How the Yearly Rankings Are Made
We have been producing yearly rankings of the most turbulent routes and airports since 2022. On this page, we will outline how these rankings are made. Don't hesitate to contact us to [email protected] if you would like to get additional information on a specific point!
Links to the 2025 rankings:
1. Turbulence data
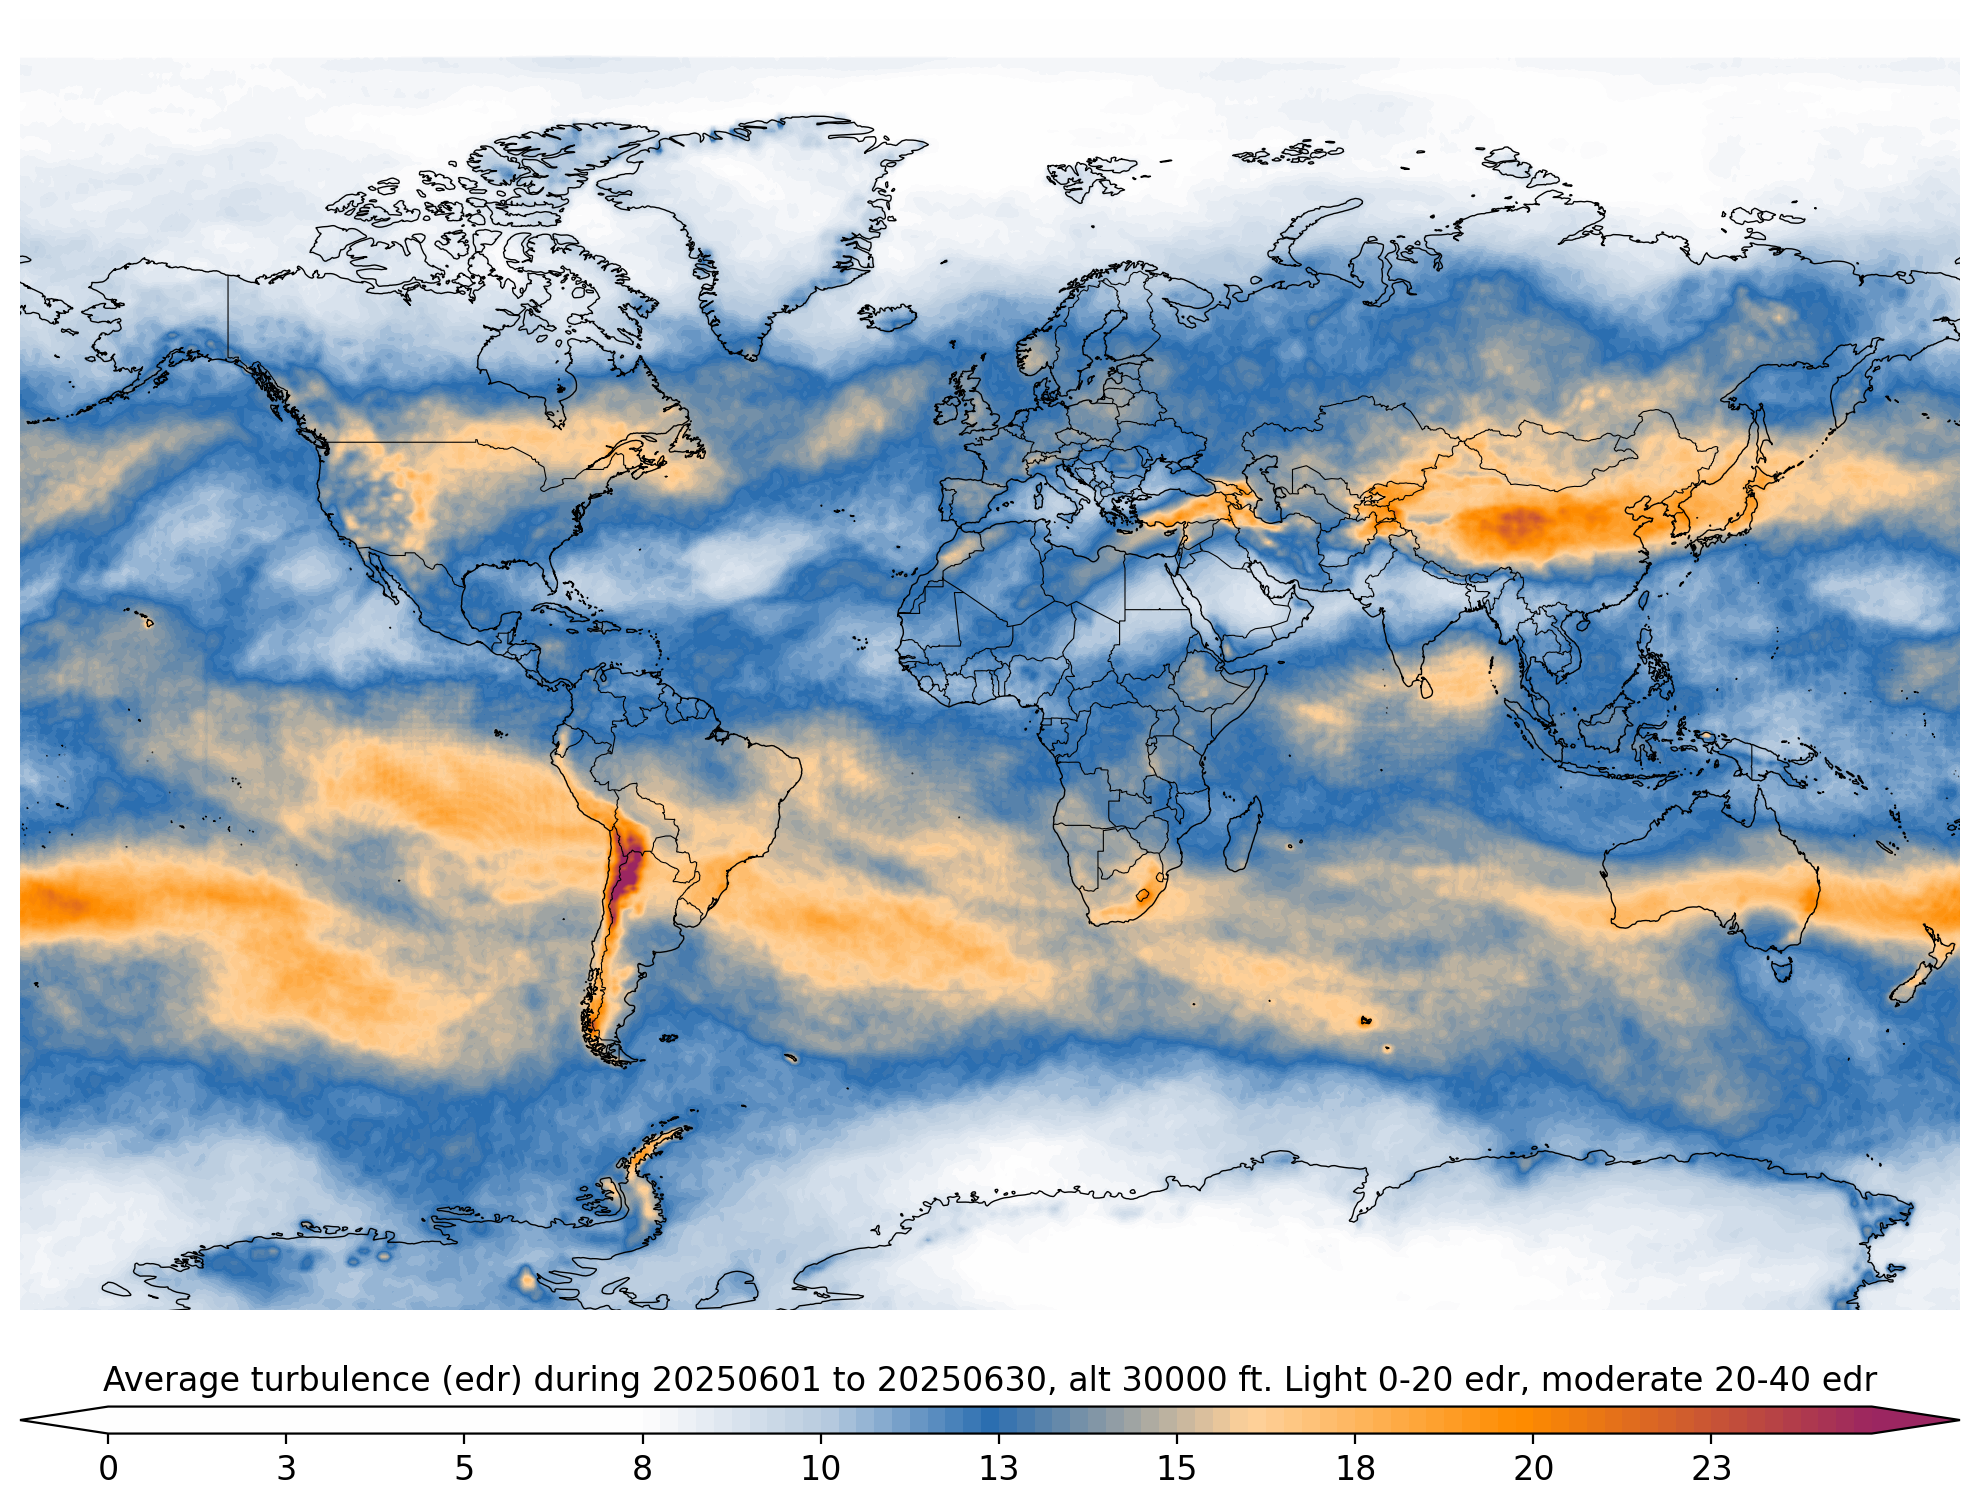
The rankings are made using turbulence forecast data from NOAA and the UK Met Office. Every 6 hours, we save a snapshot of the most recent forecast covering the entire world over 18 pressure levels, and at the end of each month, we combine them to derive monthly and finally yearly statistics.
In the rankings and forecasts, turbulence is given in units of eddy dissipation rate (edr), which is an aircraft independent unit that represents the speed at which turbulent structures break down and dissipate their energy into heat. The boundaries between different turbulent levels vary between sources. At Turbli, we assume the following scale: 0-20 light, 20-40 moderate, 40-60 mod-sev, 60-80 severe, 80-100 extreme. The ranking tables might seem to have too low levels, but this is because they are yearly averages!
Despite the chaotic nature of turbulence, there is a clear seasonal change in turbulence driven by the seasonal changes in wind, which is what triggers turbulence. For example, as jet streams get stronger during winter, so it's turbulence, especially if there are tall mountains around that could induce mountain wave activity. This seasonality and geographic variability is what allows for making meaningful ranking tables showing which one of the usual turbulence hot spots made it to the top for the weather conditions of that particular year.
 Prior to January 2024, the forecasts were only saved every 12 hours. This affects the 2022 and 2023 rankings.
2. Airport selection
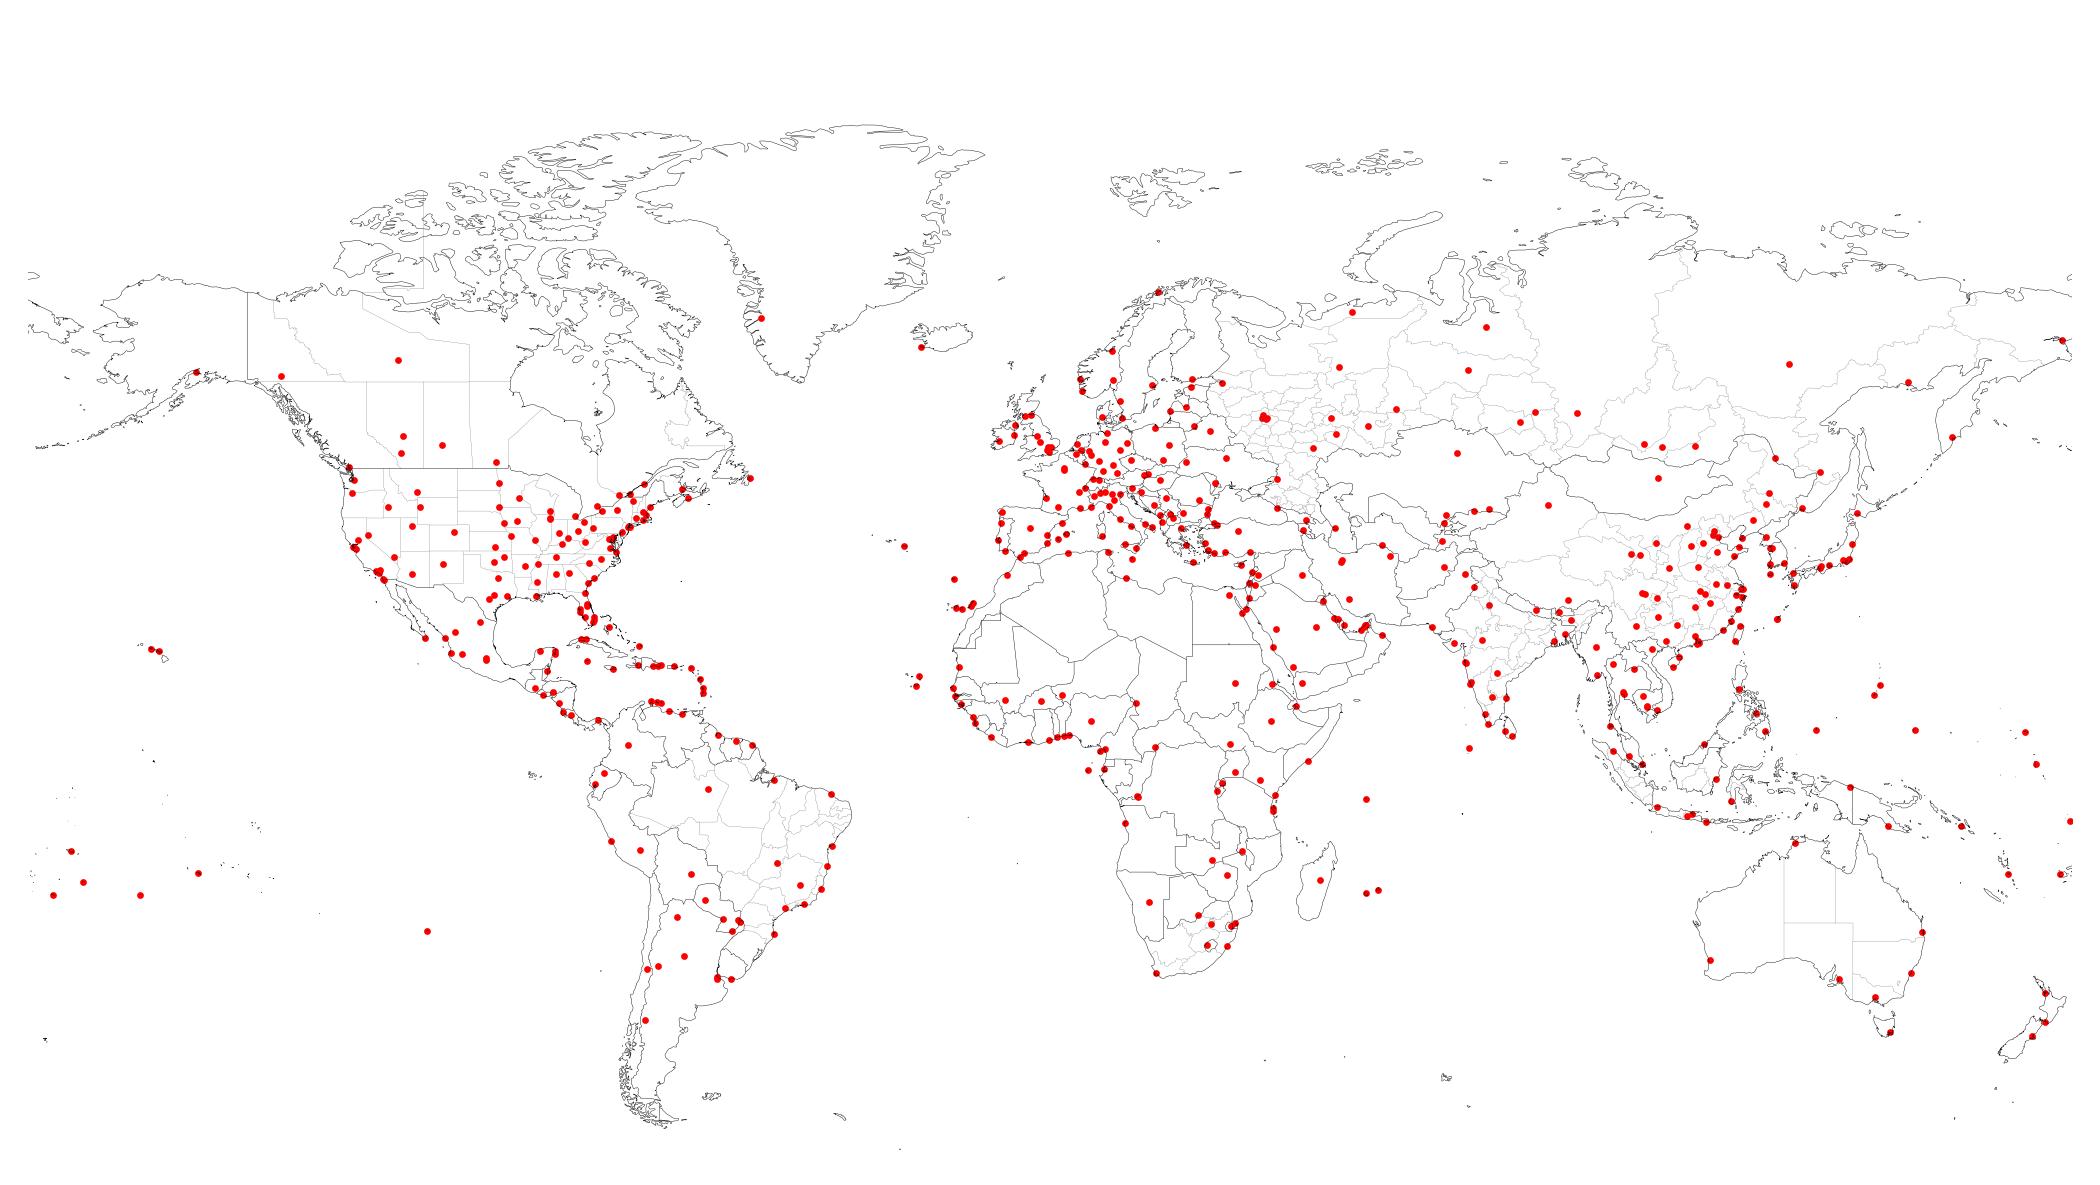
There are over 5,000 commercial airports around the world. Some of them, such as JFK in New York, are well known to everyone, but others, such as Logroño-Agoncillo, are hardly known by the locals themselves. This is why we have limited the rankings to about 550 of the largest airports in the world, but with a few additions:
- All countries: at least one airport per country, although this does not apply to city-states or small islands.
- United States and China: at least one airport per state/province, since these are large countries with a busy airspace.
- Russia, Canada, India, Brazil, Argentina, and Australia: at least one airport per top-level region (combination of several states/provinces).
Some cities can have several large airports (ex. JFK and LGA in New York), and additional large airports in cities nearby (EWR in New Jersey). Still, all large airports are included even if they fall in the same city, since it is possible that only one of them covers a certain route.
Prior to January 2024, the additional conditions of at least one airport per country or one airport per state in certain countries was not applied. This affects the 2022 and 2023 rankings.
3. Routes ranking
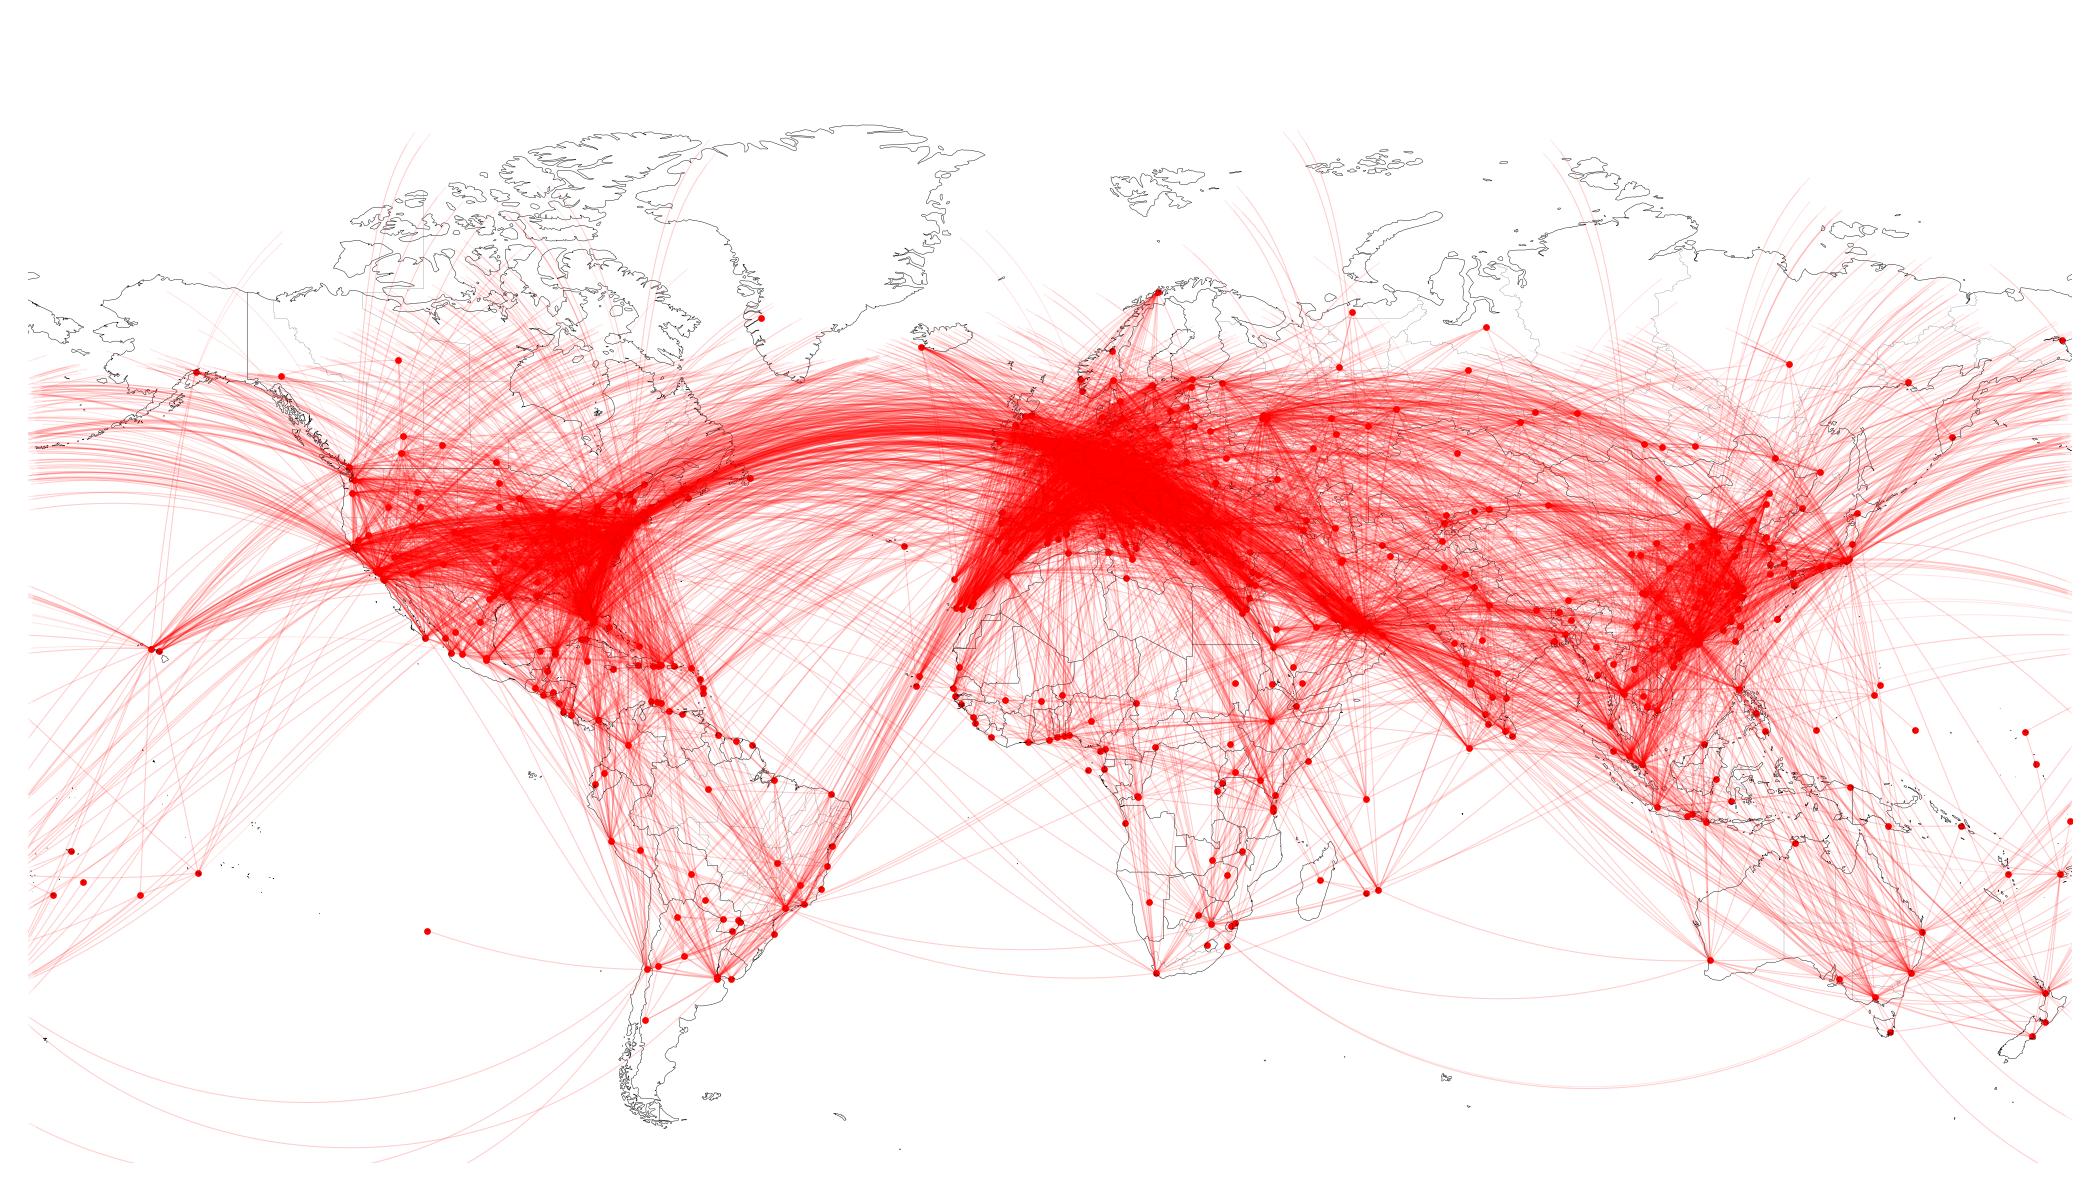
We only consider routes between the selected large airports and covered by at least one airline, resulting in about 10,000 analyzed routes per year. Understandably, high traffic regions such as the United States, Europe and China end up having a higher route density.
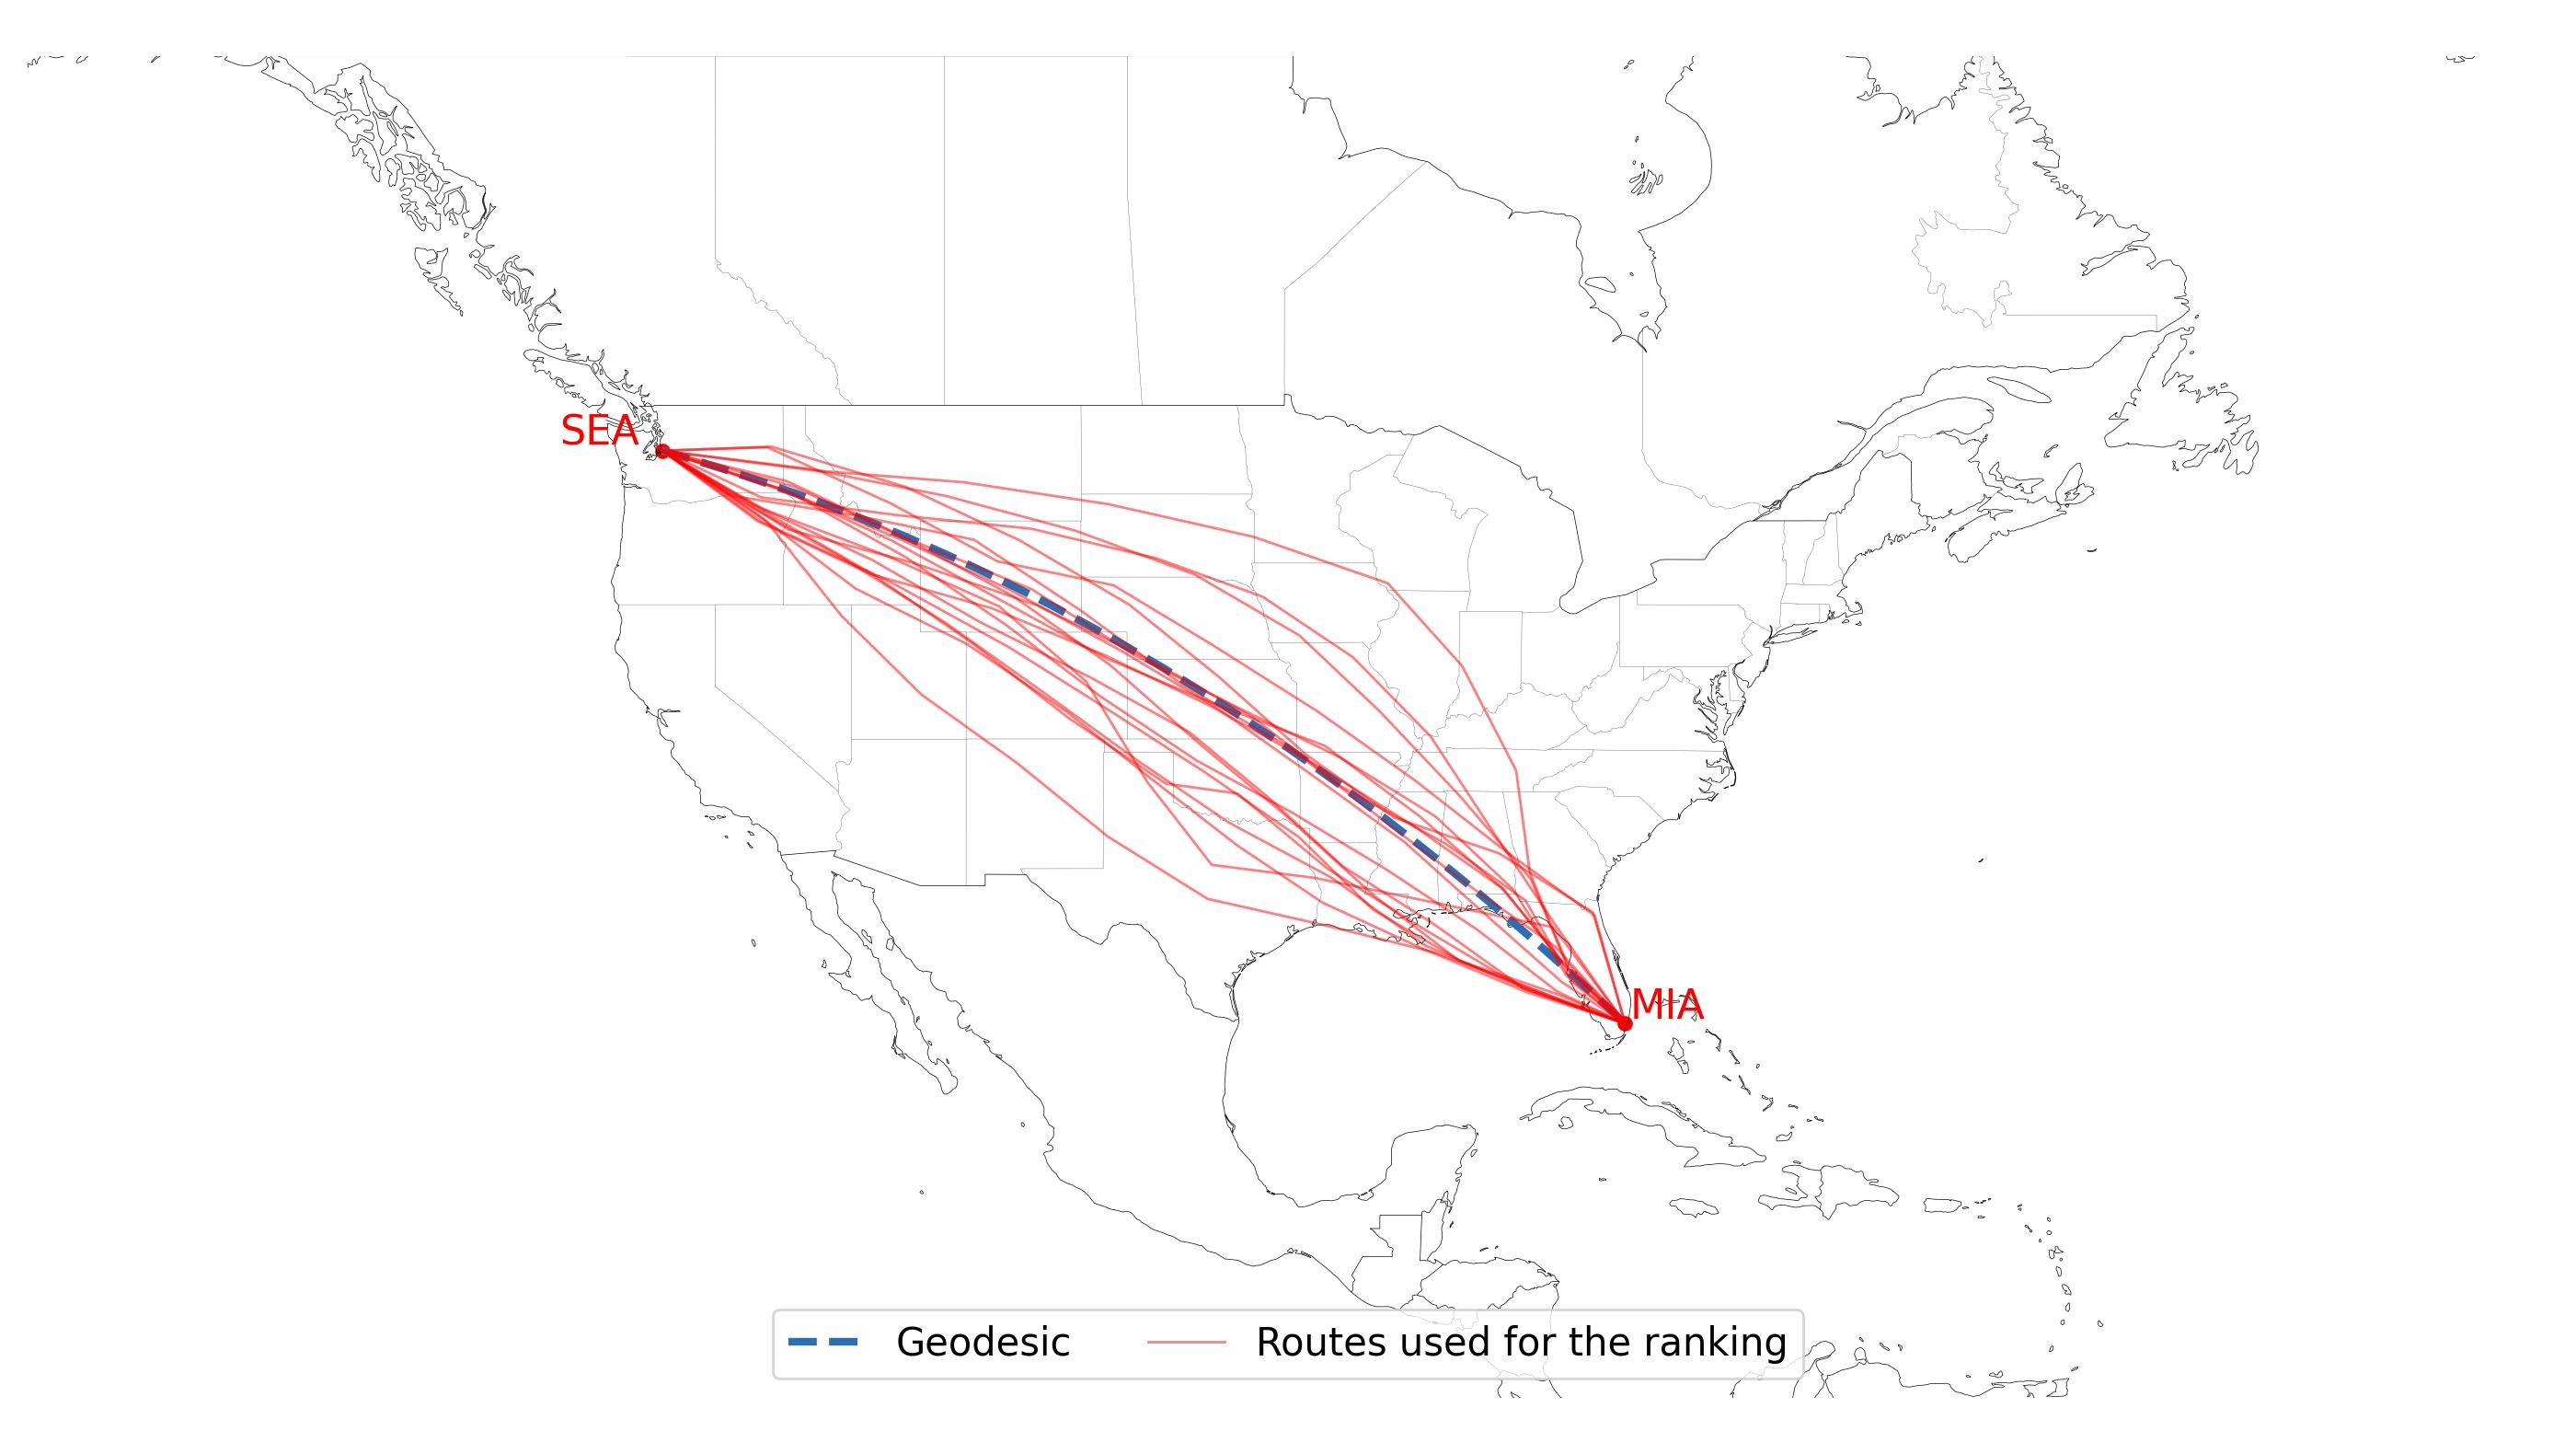
Every month, the average turbulence of each route is calculated over a random sample of up to 20 flight tracks taken from our internal tracking database (in the cases where a flight track is unavailable, we assume a geodesic route). Turbulence is evaluated both at cruise altitude and along the climb and descent. At the end of the year, all monthly data is combined to get the yearly average of turbulence for each route, and the rankings are generated. The total number of flight tracks where turbulence is evaluated is about 1.4 million.
The monthly division is done to account for possible changes in route management over the year. Due to geopolitical issues, some routes might differ substantially between months or even between airlines. For example, as of December 2025, some Europe to China routes go over the Middle East, whereas Chinese airlines are still able to fly over Russia. In the rankings, both of these routes are taken for the average, since both of them are equally relevant for different passengers.
The limit of 20 monthly tracks per route is done to ensure that all averages are based on a similar number of tracks. Otherwise, busy corridors such as Beijing to Shanghai could rank lower due to their wider averaging space.
For the rankings, routes between two airports (ex. Madrid-London and London-Madrid) are considered the same route since otherwise almost all city pairs will be repeated. For the cases where the same route exists between one city and two other airports in the another city, only the one connecting to the largest airport is kept (ex. Denver has nonstop flights to both LaGuardia and JFK in New York, so only Denver-JFK route is kept). Finally, routes with distances shorter than 100 km (62 miles) are discarded, although they do exist in commercial aviation for areas with challenging geography such as between islands or over mountain ranges.
Prior to January 2024, all routes were assumed to be a geodesic (shortest path between two airports) and turbulence was only assessed at the cruise level, not during climb and descent. This affects the 2022 and 2023 rankings.
4. Airports ranking

The turbulence around each airport is computed over a volume of 120 miles (200 km) in diameter and 20000 ft (6000 m) in height. This is computed for every turbulence data file and the values are averaged at the end of the year.
Since the first available altitude in NOAAs turbulence forecast is located at 10000 ft, the volume where the turbulence is averaged does not start at ground level but 10000 ft above the airport. This means that we are not able to capture and rank low level turbulence, which might be relevant for some airports. Therefore, the turbulence in the airport ranking should be regarded as the one during the approach or descent.
Important! Turbulence and runway crosswinds should not be confused. Turbulence is relatively homogeneous, meaning that no matter the direction of the plane, it will get bumpy when it passes though it. On the other hand, airports where the crosswind level in the runway is high will lead to a more challenging and bumpy landing, even if the wind is blowing steady with little turbulence. Crosswinds are entirely dependent on runway orientation: flip the runway 90 degrees, and the crosswinds become an easy to manage headwind. The rankings presented here rank turbulence, not crosswinds.
Prior to January 2024, NOAAs forecasts covered all the way down to zero altitude, instead of starting at 10000 ft as today. These low level layers were included in the 2022 and 2023 rankings.
Accuracy of the rankings
The rankings developed by Turbli are based on a statistical and big-data analysis, making them more reliable than those derived from the pilots or passengers, since these are biased towards their specific experience. Nevertheless, the accuracy of the rankings can be affected by the following.
The rankings are based on forecasts, which, despite the recent improvements in prediction skill in jet stream and mountain wave turbulence, they are not 100% accurate.
An important challenge with turbulence forecasts is that their current resolution is too coarse to predict turbulence inside and around thunderstorm clouds. Thunderstorms are very common in the Intertropical Convergence Zone (ITCZ), so the forecasts are likely under estimating turbulence there and might rank too low the routes in that region. But there is an important detail here! Due to the extreme turbulence found inside large thunderstorm clouds, pilots always avoid them. The turbulence event in the SQ321 flight in May 2024 is a stark reminder of that. Therefore, not including thunderstorm turbulence in the rankings is somewhat adequate since pilots will not go through these clouds, and, except in rare occasions, not experience that turbulence.
Convective-permitting forecasting models are in the horizon and might provide a better thunderstorm prediction in the near future. But, given the computational requirements of such model, we are still a few years from that.
Measurements could also be used for rankings, but these lack fine coverage and are limited to specific world areas. Available measurements are the PIPREPs database (limited to the United States, and subjective to the pilot interpretation), or the AMDAR database, which provides actual turbulence measurements from planes (although only a few airlines have added the equipment needed to take these measurements, mainly in the US). The AMDAR has the added challenge that (based on our analysis) turbulence seems to be greatly over estimated at low altitudes, most likely due to plane movements during climb and descent that are wrongly characterized as turbulence.