Are Night Flights Less Turbulent? 25 Million Measurements Give the Answer

Night flights have often been credited to be smoother. But, is this really true? And if so, why is it?
In this article, we use AMDAR measurements provided by the National Center for Atmospheric Research (NCAR)/EOL to quantify the different levels of turbulence between day an night over the United States and the North Atlantic during 2021.
The AMDAR system
The Aircraft Meteorological Data Relay (AMDAR) is a system that transmits real-time weather measurements from planes to meteorological organizations across the globe. The system is maintained by the World Meteorological Organization since 1998, and the data is particularly useful for weather forecasting and research.
As of October 2023, there are 43 airlines participating in the AMDAR program, concentrated mainly in North America (12), Europe (14) and Asia (10). Together, they provide over 700,000 daily measurements of wind speed, wind direction, pressure and temperature.
Measuring turbulence: EDR vs DEVG
Unfortunately, turbulence measurements are rarely provided by AMDAR since doing so requires a special equipment that only in some airlines have.
To make it more complex, turbulence is measured differently depending on the region. In the US, planes measure it in terms of Eddy Dissipation Rate (EDR), an aircraft-independent measure of turbulence which is now the standard for all turbulence forecasts. Moreover, EDR measurements are independent of the plane's maneuvers when filtered adequately. For example, a sharp turn of the plane after takeoff will not lead to a high EDR value.
In Europe and Asia, turbulence is measured as Derived Equivalent Vertical Gust (DEVG). There are correlations to convert DEVG to EDR, but these have uncertainties and comparison between the two is not always easy.
The EDR turbulence scale ranges from 0-1, but we show the values multiplied x100 to improve their readability. With this, the turbulence levels for different EDR values is roughly as follows:
- Null: 0-10
- Light: 10-20
- Moderate: 20-40
- Severe: 40-60
- Extreme: 60-100
Data coverage and quality
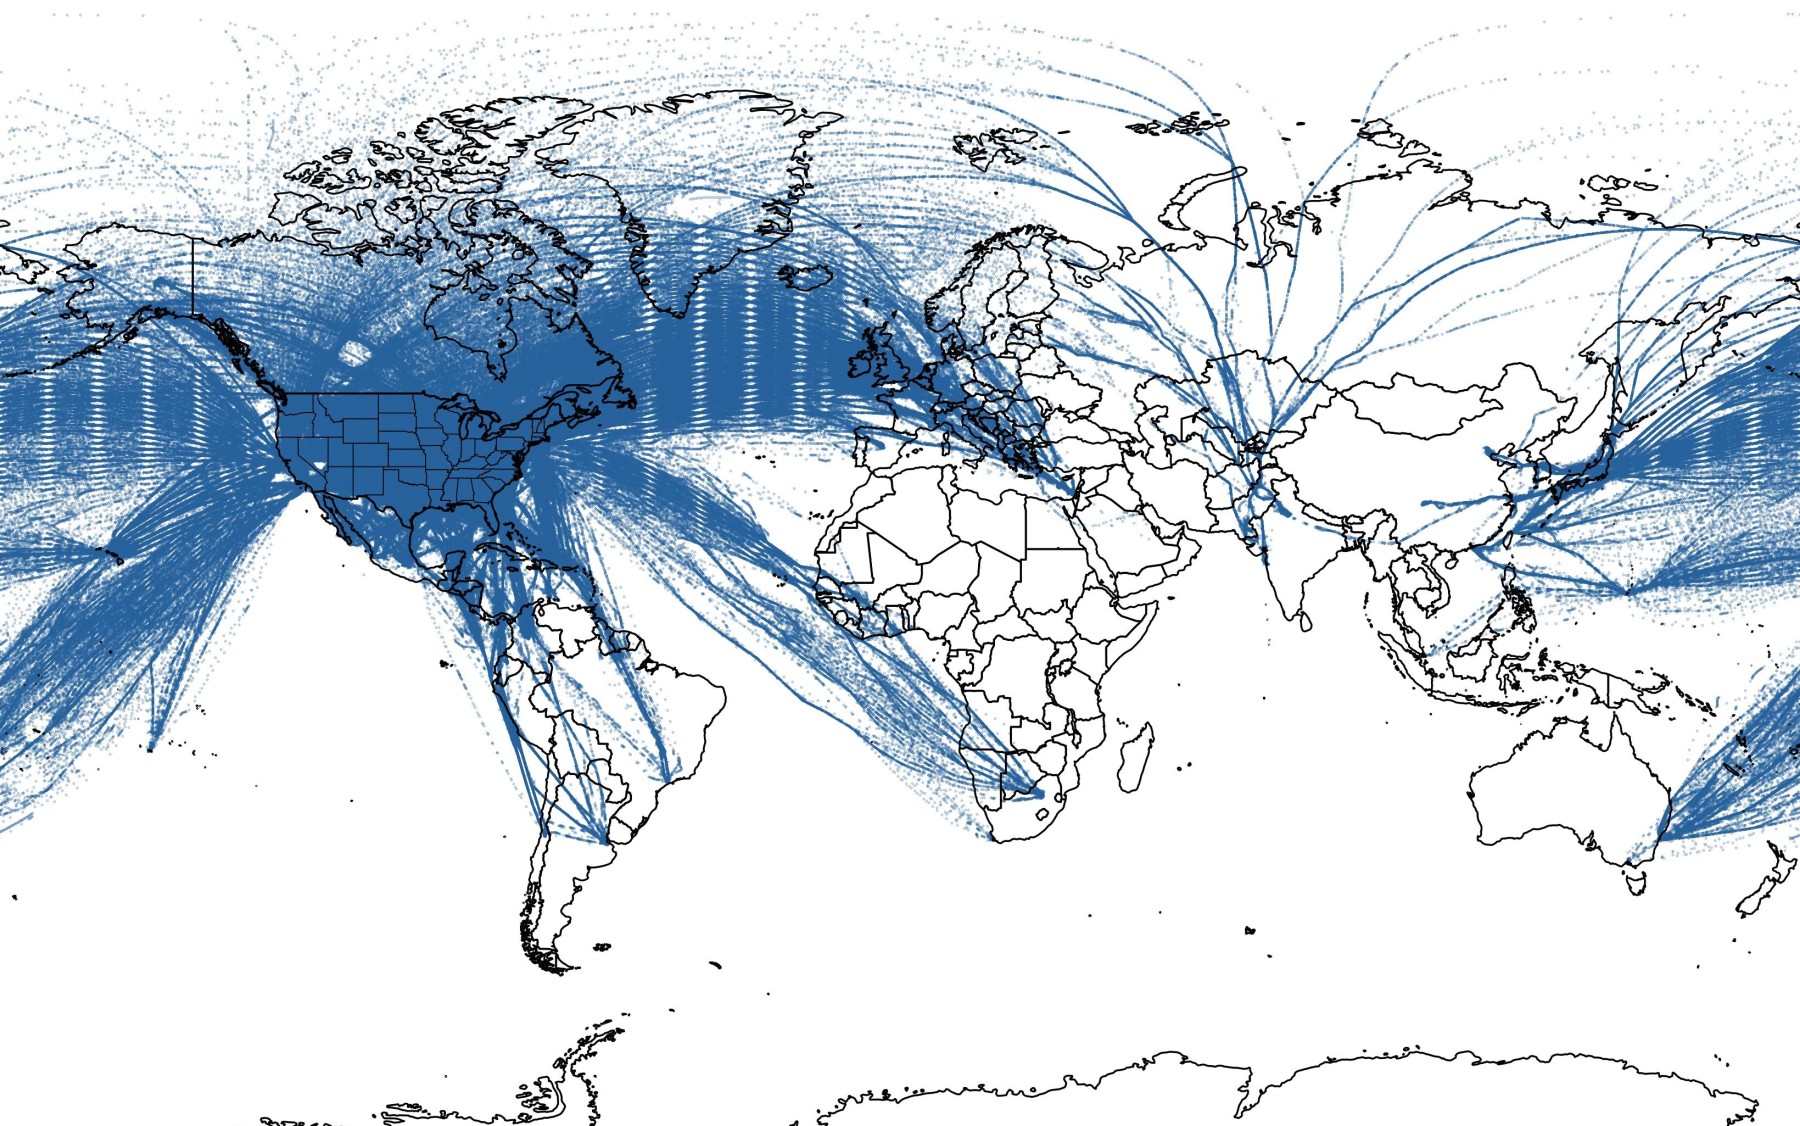
The EDR data from 2021 highlights the impressive amount of routes from the United States towards Europe, Japan, Australia, and South Africa. However, we can see that the coverage is not complete, with several blank areas even in busy routes. This is why we will limit ourselves to the two areas with most traffic: the United States mainland and the North Atlantic. Due to the limited coverage, this article will not answer if night weather in less turbulent than day one, but if night flights are so.
In 2021, there were a total of 51 million EDR measurements (25 million in the zones that we will analyze). From these, about 48 million measured an EDR value equal to zero. This might seem reasonable, since the majority of the atmosphere is in a light turbulence regime; but is it really at zero turbulence? No turbulence means laminar flow, a flow where all the particles travel parallel to each other (laminar), and swirling motions are not possible. Laminar flow in the atmosphere is very rare. So why so much zero turbulence?
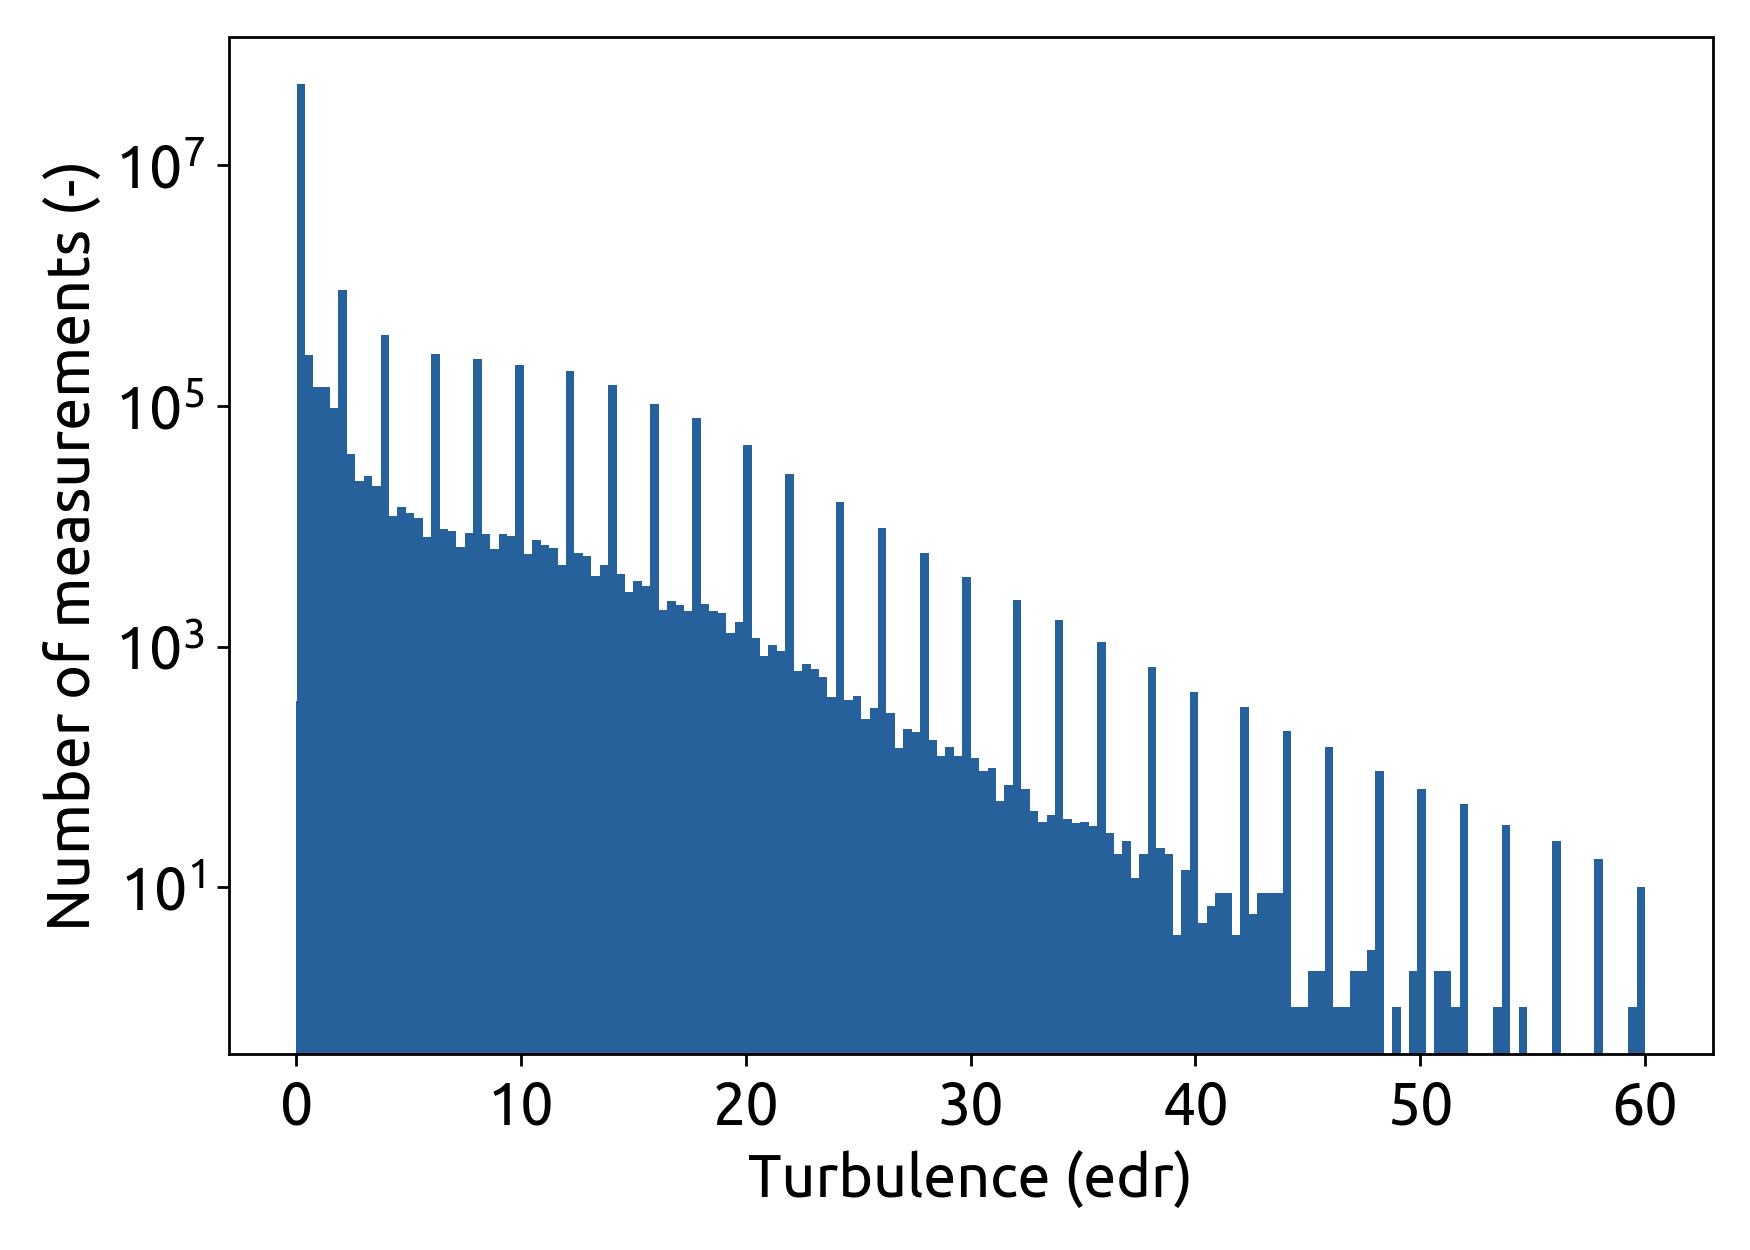
The reason for so many zeroes seems to be that most of the EDR values are rounded to multiples of two. For example, an EDR measurement of 7.75643 would be rounded to 8, or to 6 if it's rounded down. This means that all turbulence below EDR values of 2 were likely rounded down to zero. This is unfortunate since, given the bulk of data below 2, small changes in this range can have a large impact in the statistics.
Why not forecasts?
If the low coverage of the AMDAR data is a problem, why not use turbulence forecasts like the ones we use in turbli? These have complete coverage at many altitudes.
The main problem is that the 13 km resolution current turbulence forecasts is too small to resolve clouds, thunderstorms or convective turbulence. This is why in our site a thunderstorm forecast is provided together with the turbulence forecast for each flight.
Since convective turbulence plays an important role at low altitudes, we decided that it would be better to use real aircraft measurements instead.
The United States
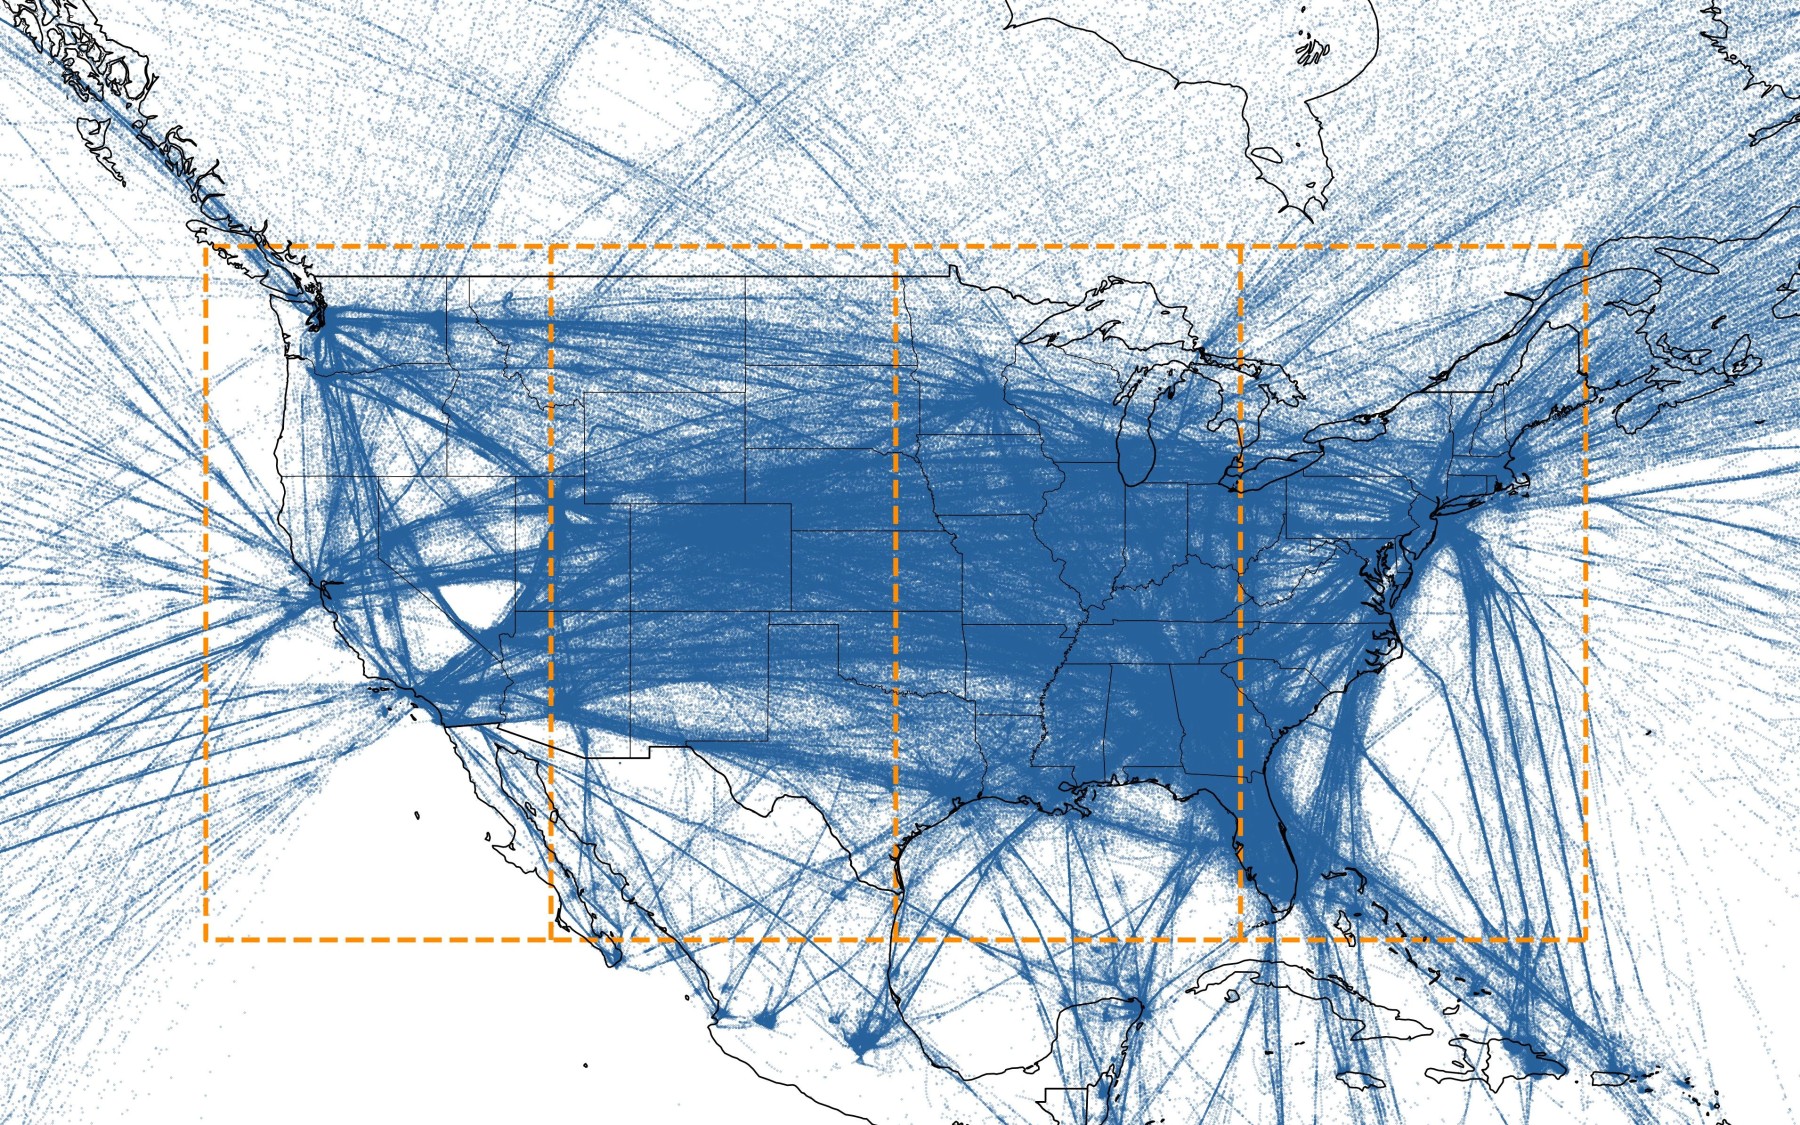
Despite the thorough coverage of the United States, we can see that the West Coast has a lower density than the East Coast. Area 51 in the Nevada desert is completely blank; as expected, since the Federal Aviation Administration has closed the airspace for decades.
The United States mainland spans over 4 different time zones. In each one, the AMDAR turbulence reports were split into sunrise, day, sunset and night stages depending on the hour that they were taken. The hour ranges for these stages were defined taking into account the differences in sunset and sunrise time between different latitudes and the changes of these times throughout the year.
- Sunrise: 5-9 (4 h)
- Day: 9-17 (8 h)
- Sunset: 17-21 (4 h)
- Night: 21-5 (8 h)
Taking the average for each zone, we can see that it results in higher turbulence during the day than during the night. However, this is the total average, across all the altitudes. If we plot the data as a function of altitude we can see that the higher day turbulence is mainly due to the lower levels of the atmosphere. But why does this happen?
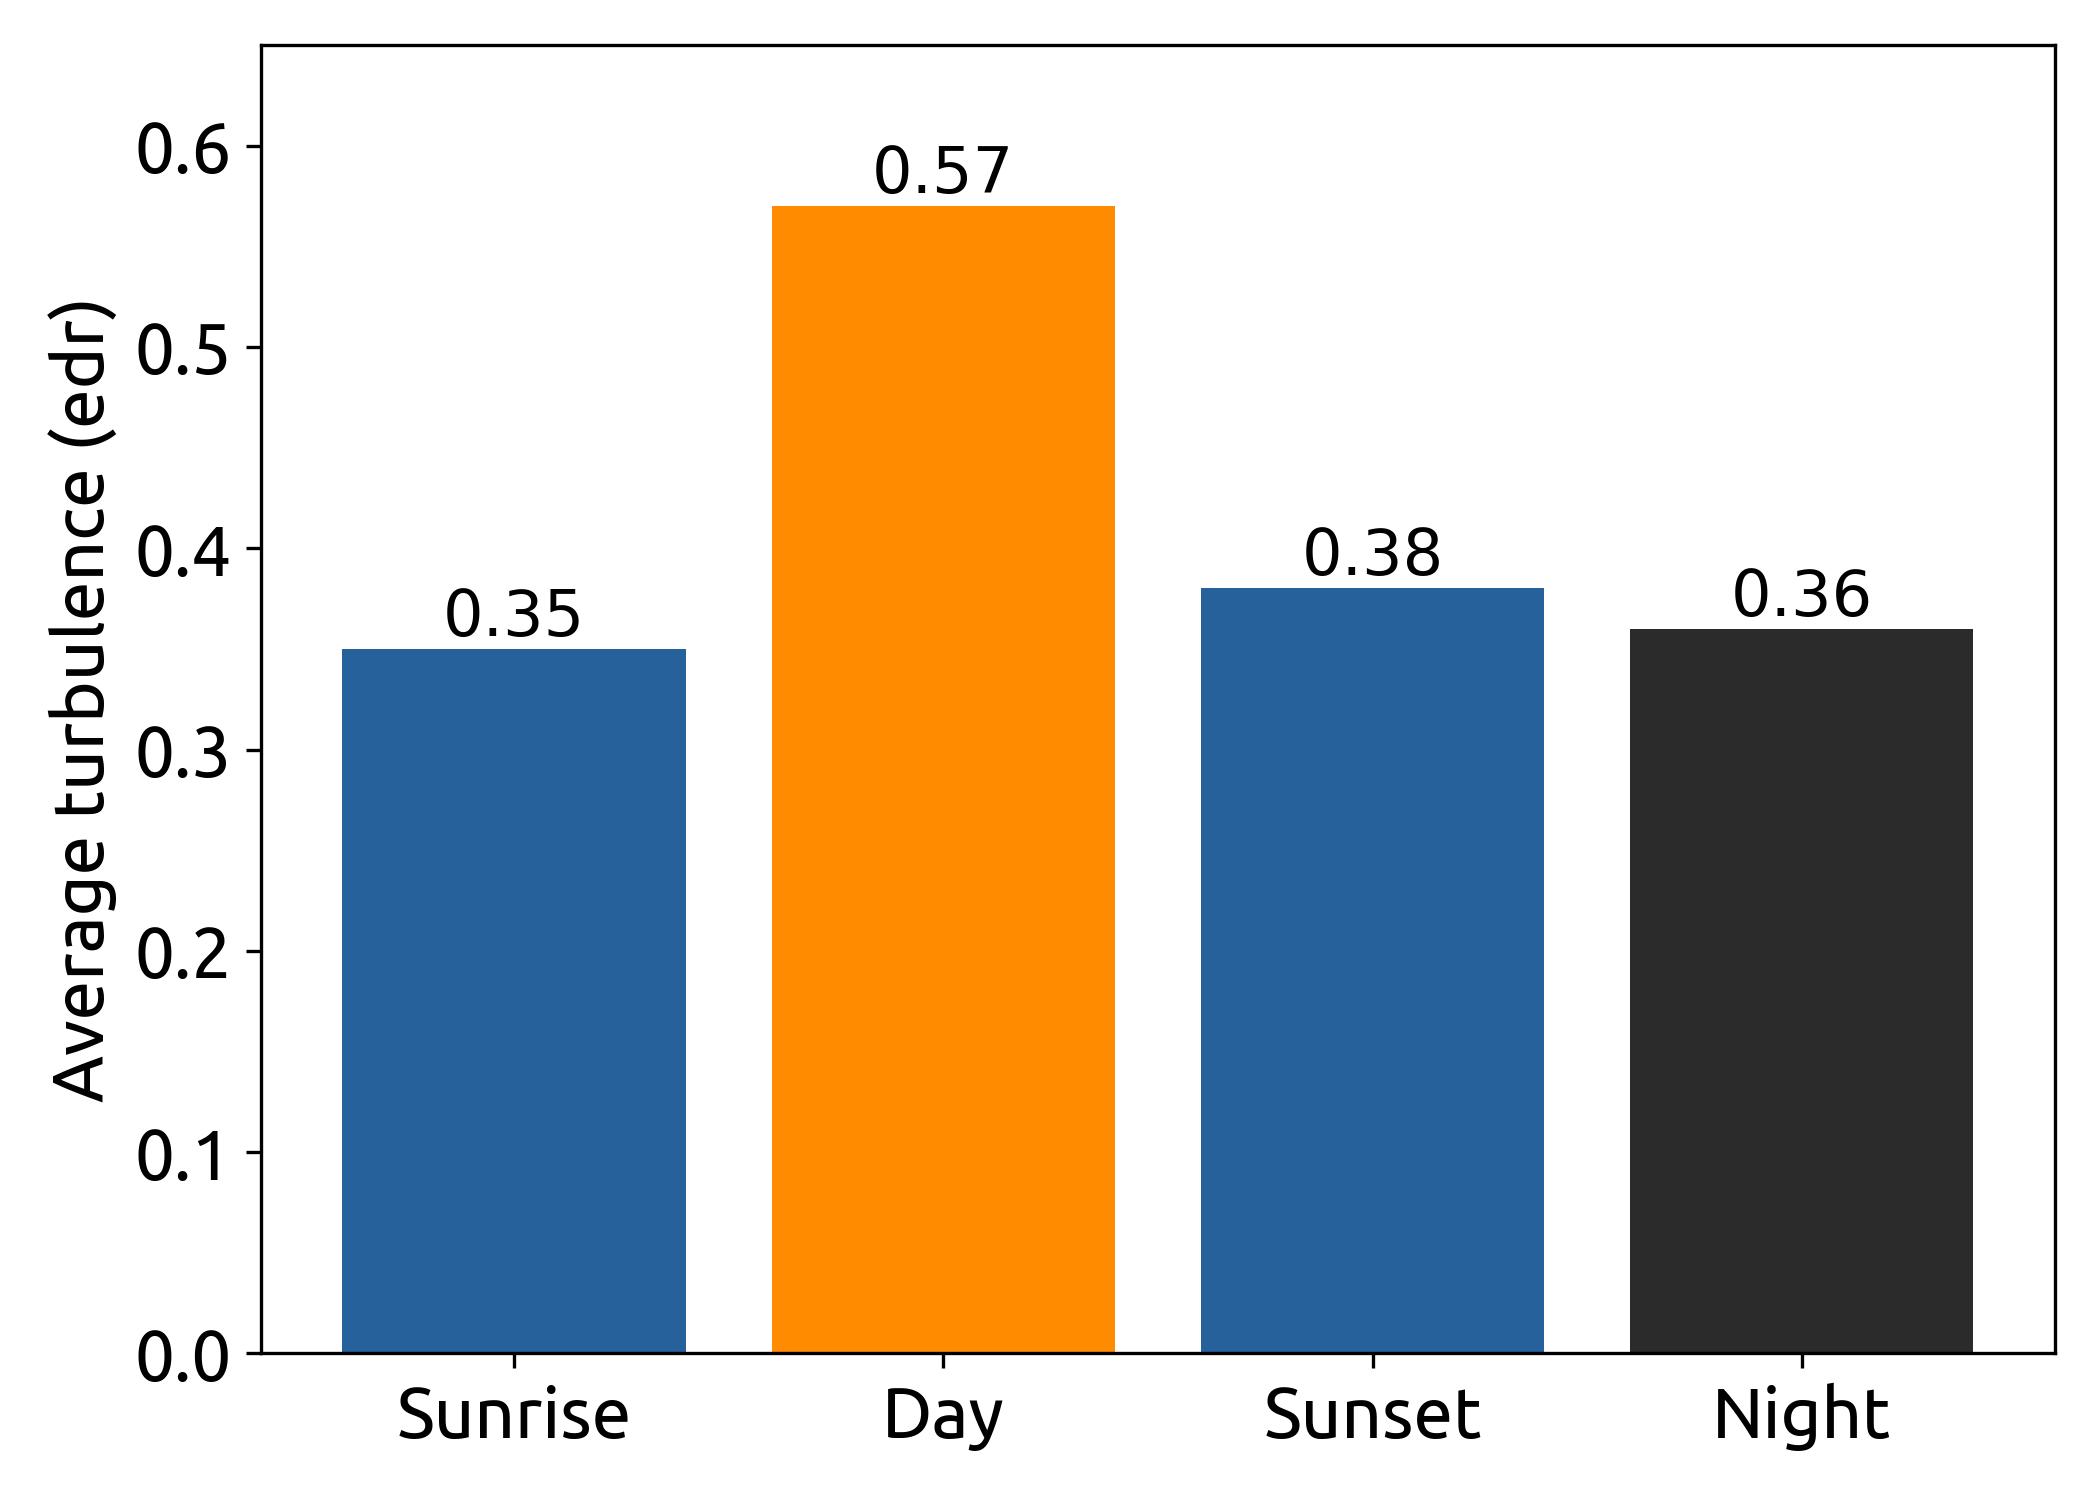
Low altitude turbulence is largely affected by the temperature difference between the Earth's surface and the air above. During the day, the surface is warmed up by sun rays, resulting in rising thermal plumes or in the development of thunderstorm clouds in moist environments. During the night, the surface cools down and most of these factors decrease their strength.

High altitude weather has a much higher inertia. Is it no longer controlled by small day/night cycles but by slow seasonal changes. One example are jet streams, traveling at over 250 km/h around the Earth, driven by the Coriolis force and the Equator to Pole temperature difference. This results in stronger jet-streams during winter, and weaker during summer. A change in day and night has very little effect on them.
But why is the turbulence at high altitudes so low? Previous studies have shown that the turbulence at cruising altitudes is comparable to that at low levels. The altitude range with lowest turbulence is in fact between 4,500 to 6,000 km (15,000 to 25,000 ft). The only explanation would be that pilots are getting better at avoiding turbulence during cruise. At low altitudes, avoiding your landing airport is generally not an option, even if it's surrounded by turbulence.
Still, the difference between low and high altitudes seems way too high to be attributed to route planning alone. I have been in many flights myself, and I can say that low level turbulence hasn't been 20 times worse on average than at cruise (20 is the factor that the altitude plot shows). How can it be that at high altitudes EDR = 0 is measured 95% of the time, but below 2,000 m (6,500 ft) only 55% of the time? There is something else at play in the AMDAR data, but it remains to be understood.
The North Atlantic
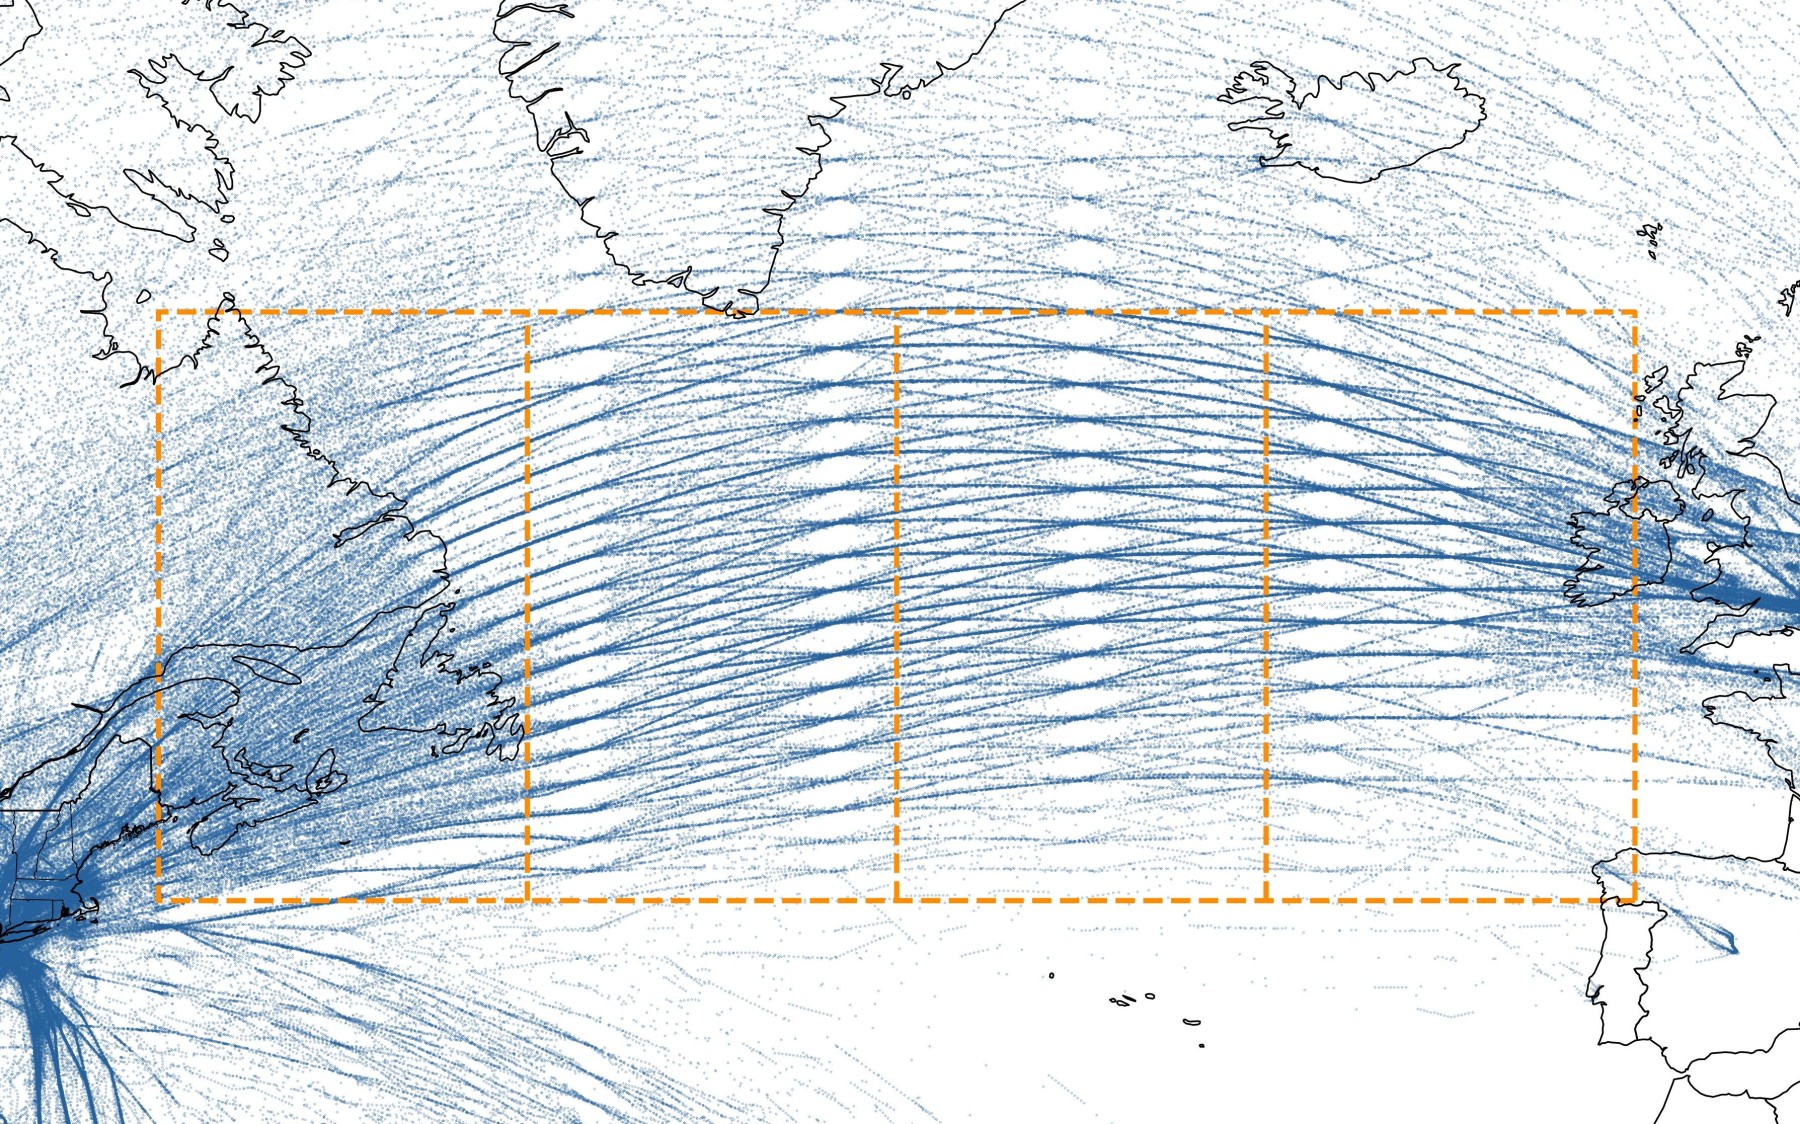
First of all, we have to credit the excellent work done by pilots and Air Traffic Control (ATC) to keep this airspace as tidy as it looks. Their main target: ensure separation between planes to avoid collisions.
Going into the turbulence values, almost all the data from the North Atlantic corridor is at altitudes above 10,000 m (32,800 ft). Like in the US, four different time zones were again considered, but given the higher latitudes of these areas, the ranges for the day and night had to be shrunk to:
- Sunrise: 4-10 (6 h)
- Day: 10-16 (6 h)
- Sunset: 16-22 (6 h)
- Night: 22-4 (6 h)
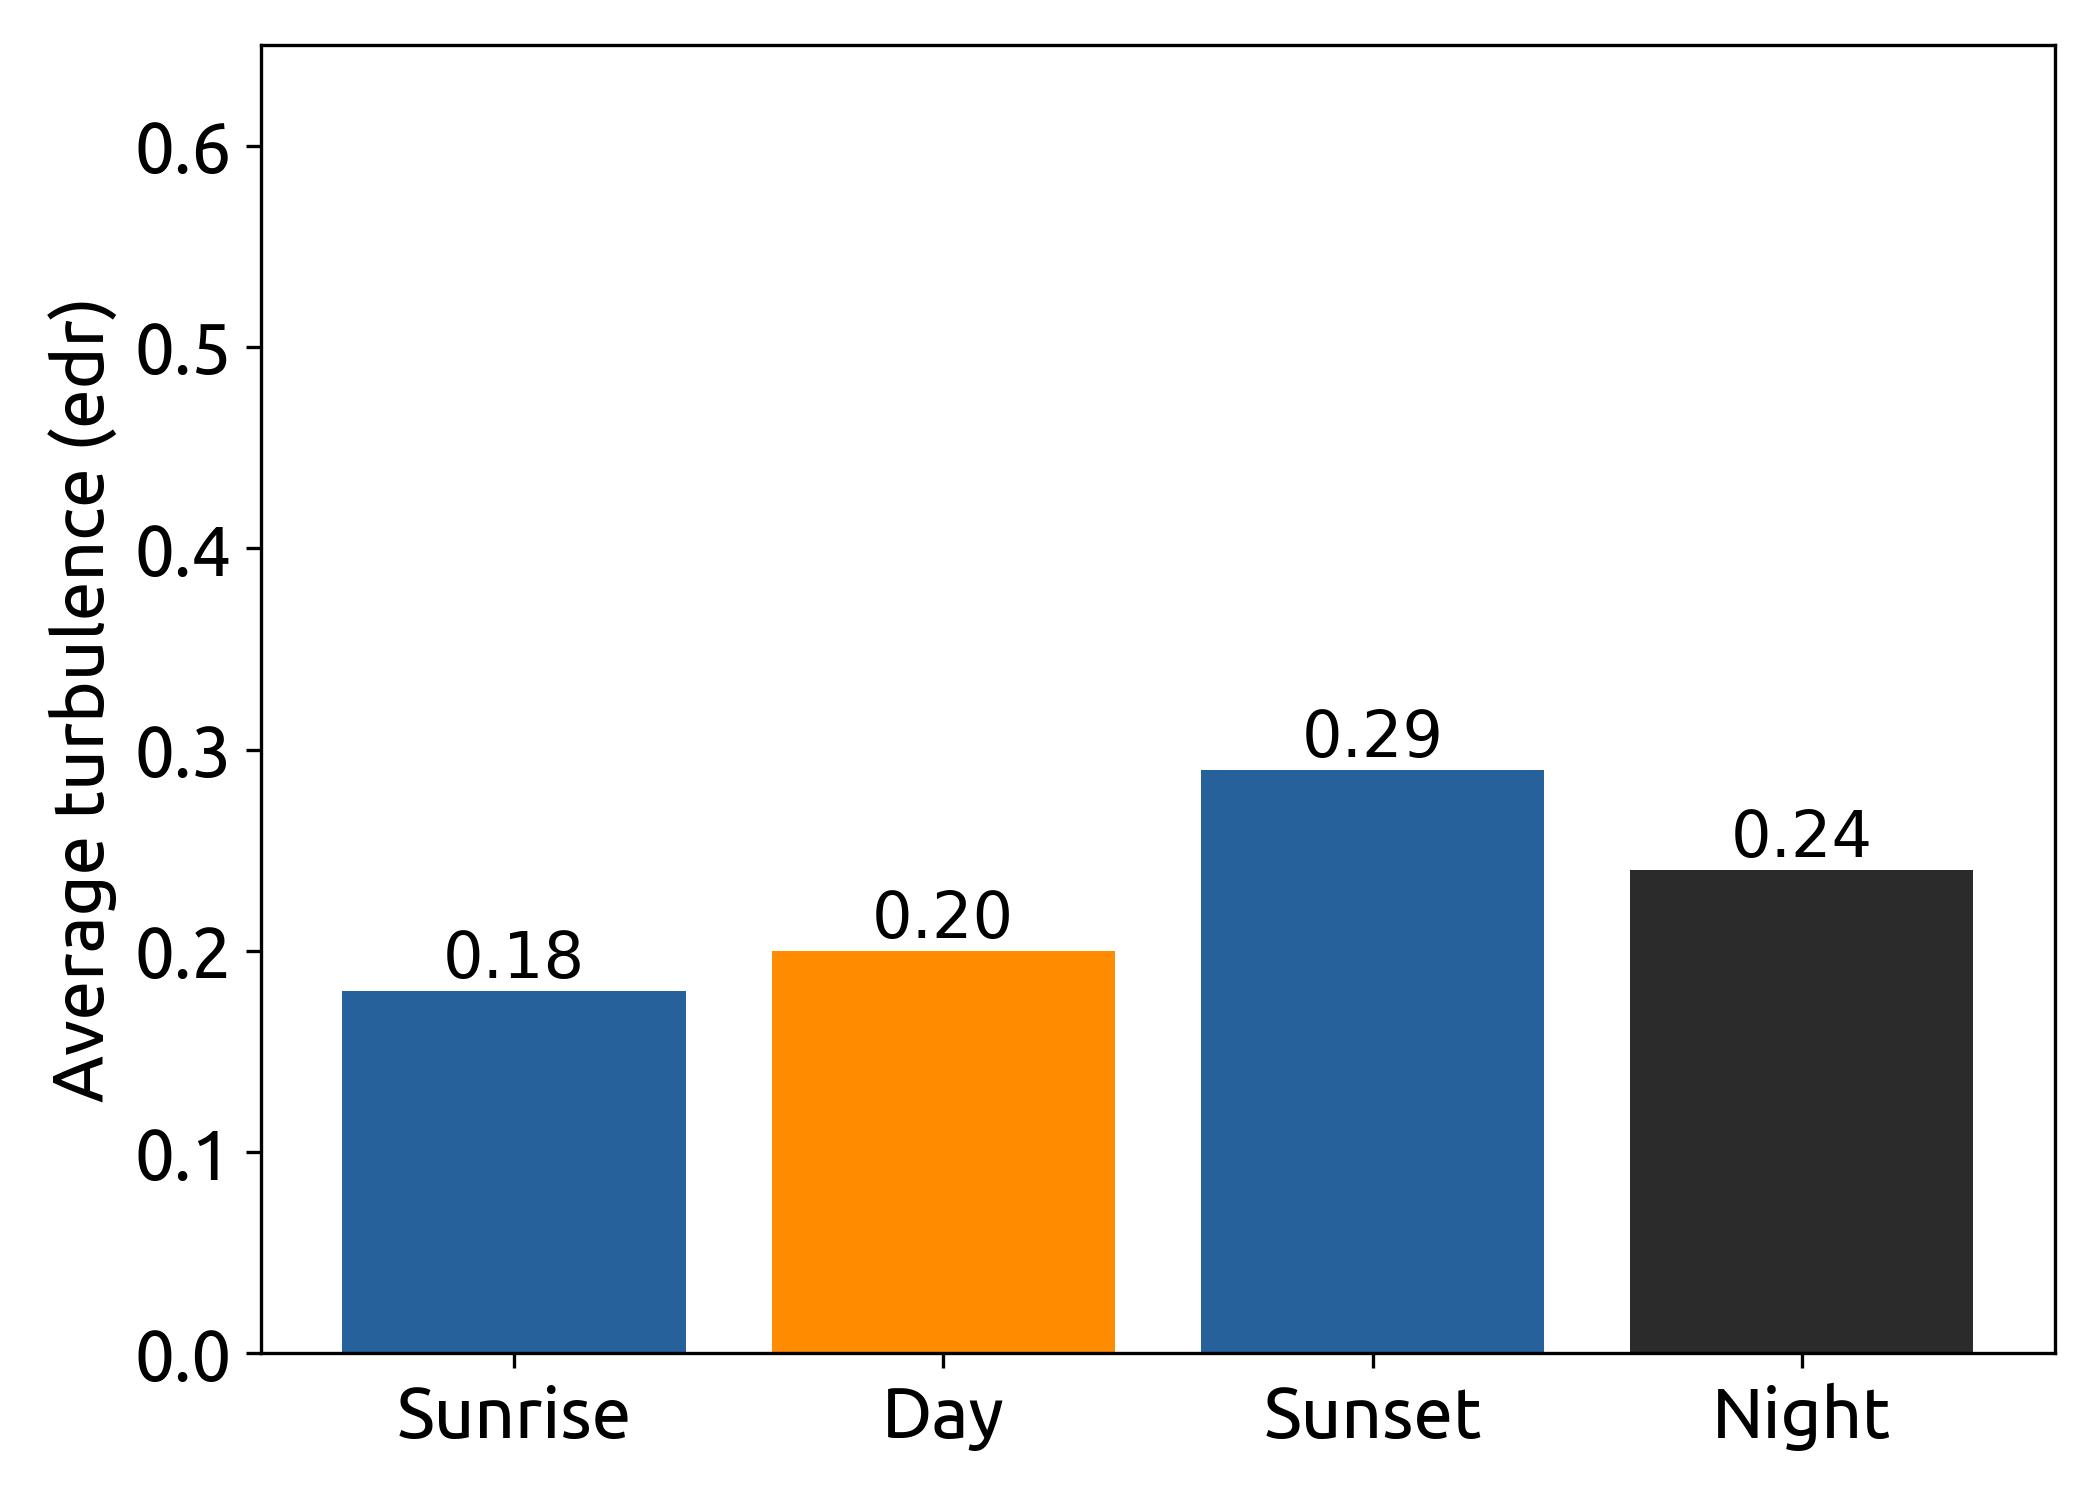
Over the North Atlantic, night flights appear to be slightly more turbulent than day ones. If we take a close look at the previous altitude plot, we can see the same behavior for the US data: the point at highest altitude shows nights being more turbulent.
So, are night flights less turbulent?
Based on our analysis of 25 million AMDAR data points, we can conclude that night flights are less turbulent than day ones. However, this is only true for low altitudes. At high altitudes, night seems to be slightly more turbulent, but the difference between these two might be within the statistical error of the data, specially given that each EDR value was rounded in steps of 2.
Overall, you can expect a smoother climb and descent. But once you are up to cruising altitude, there should be no difference between day and night.
So if you are taking a short regional flight where the maximum altitude is in the order of 7000 m, a night flight is likely to be smoother. However, if your route New York to San Francisco, the 40 minutes of climb and descent might be better, but you can expect the same for the remaining 5 hours at cruise altitude.
The issue with the AMDAR data showing too low turbulence values at high altitudes needs to be revised, and so will the conclusions. We will keep that for another post.