Atmospheric Turbulence: Thunderstorm Clouds
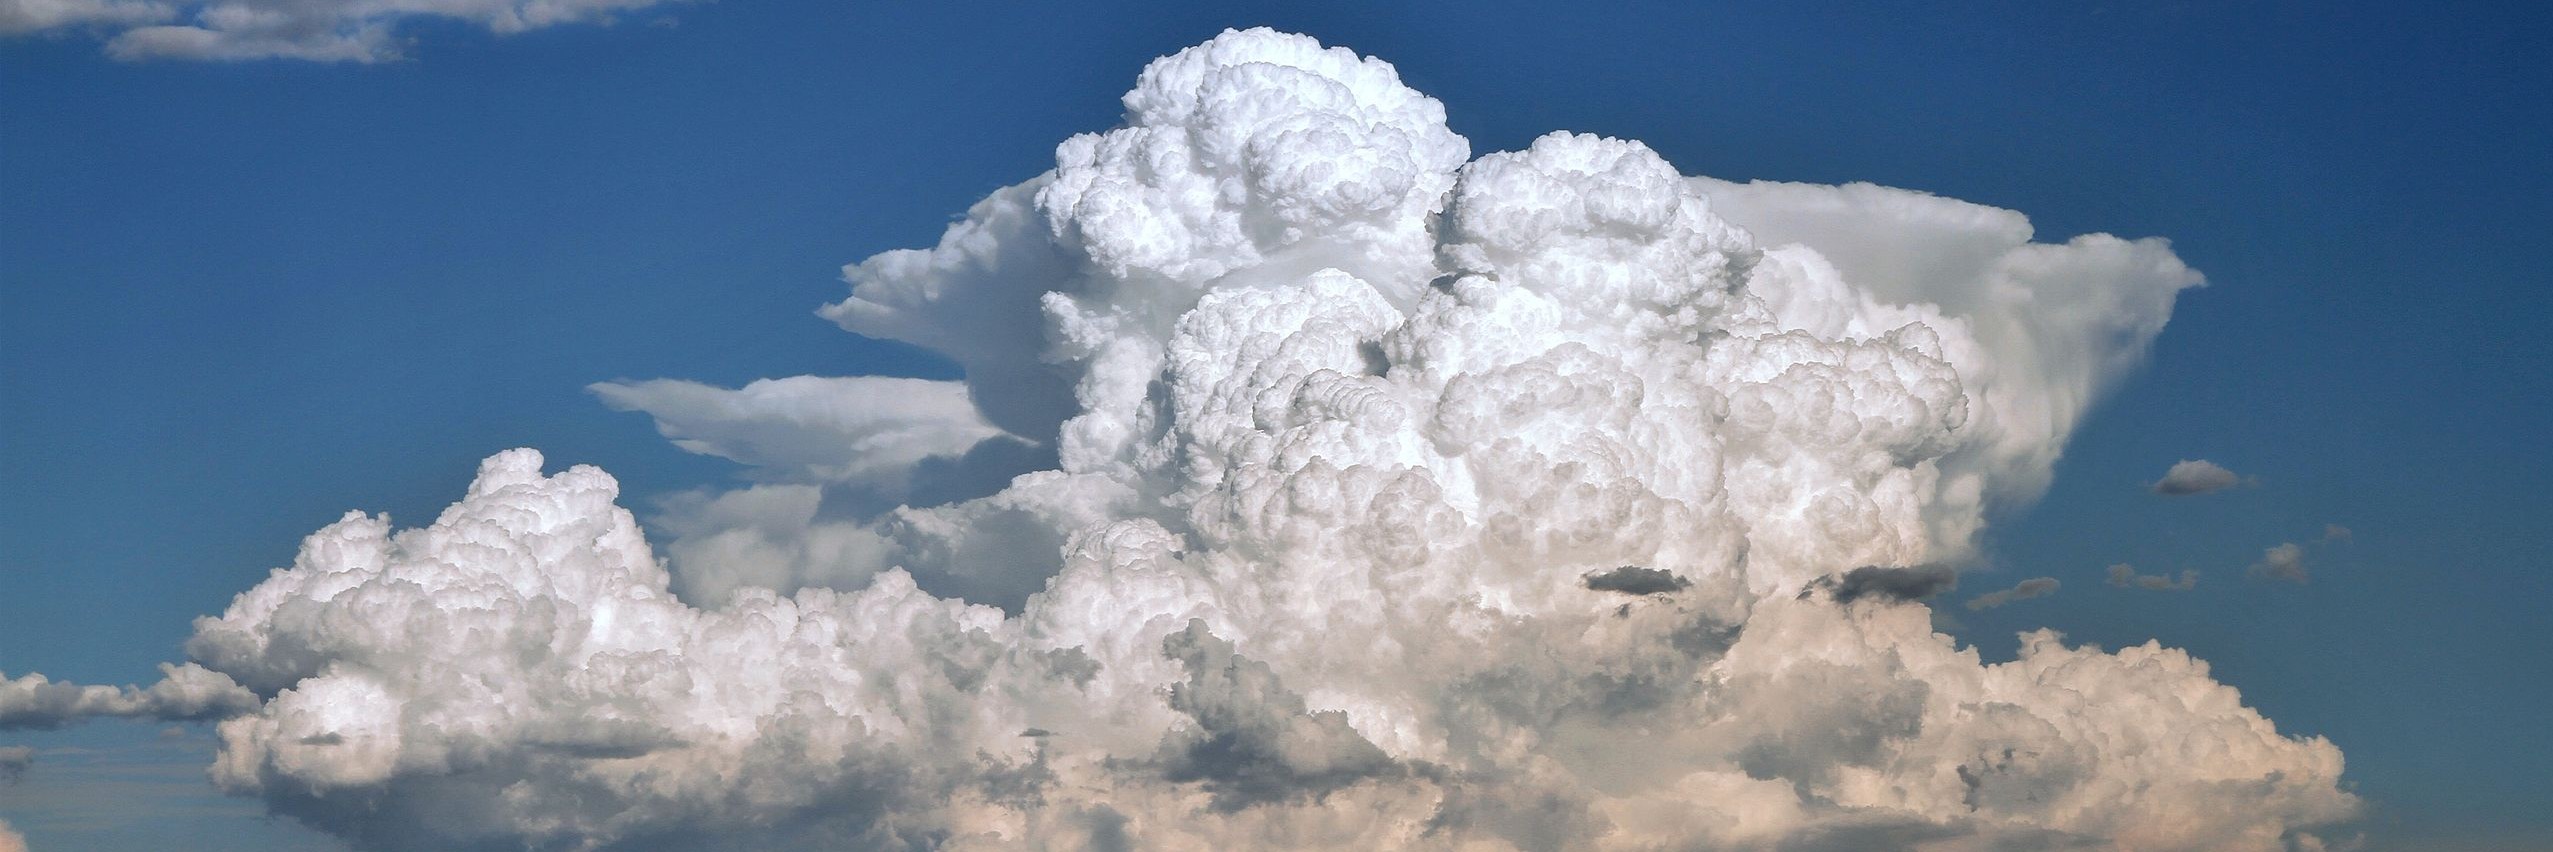
Cumulonimbus clouds, or thunderstorm clouds, are the evil of aviation. Their fluffy looking shape, much like a cauliflower, hides very strong winds, turbulence and lightning. Pilots almost always avoid these clouds.
But how are these clouds formed? Where are you more likely to find them? We let you know here.
The cumulonimbus name
Knowing a bit of Latin helps to understand cloud types. For our case:
- Cumulo: a pile of
- Nimbus: a rainy cloud
What we get is “a pile of a rainy cloud”, quite self-explanatory.
How cumulonimbus clouds are formed

The lifetime of cumulonimbus clouds can be divided into three stages:
(1) Towering stage Large masses of hot and moist air begin to rise. As the air rises, it cools down and begins to condense in the form of tiny droplets. This causes the air to warm up (condensation releases heat), helping it to raise higher due to the lower density than the colder air around the cloud. At this stage the cloud is dominated by strong upward currents which prevent the droplets from falling as rain.
(2) Mature stage At some point, there are just too many droplets for the rising air to hold. Downward currents appear and start pouring rain or hail over the ground. The cloud now contains two counter-direction currents, the updrafts bringing fresh “fuel” (hot moist air) and the downdrafts returning it in liquid or icy form. The cloud might also present the characteristic “anvil “ top shape, a flat surface due to having reached the stratosphere.
(3) Dissipation stage Once the cell of hot moist air has been exhausted, there is nothing left for the cloud to feed on, and the rain and hail will be gradually reduced.
After reading this, you might be wondering: isn’t this how all clouds are formed? In general yes, but the key difference of cumulonimbus clouds is that the amount of hot rising air is so large that the cloud will not just form and sit on the skyline. It will continue rising and rising and form its typical tower-anvil shape.
Cumulonimbus and turbulence

The air entering the base of the cumulonimbus cloud is usually very smooth. Hot air rising and gradually getting cold actually reduces the chances of generating turbulence.
Once inside the cloud, severe levels of turbulence can be expected. Most researches agree that the strongest turbulence is found where the upward and downward currents meet. Here the air will be subject to strong shear forces which will trigger the formation of large and unstable rotating vortices.
But the turbulence is not limited to the inside of the cloud. Strong turbulence can also be found up to 5 km above the anvil. Therefore, even if the cloud appears to be well below for a pilot, passing right above it should be done with caution.
Cumulonimbus and lightning

Collisions between water droplets and ice particles generates static electricity, similar to that generated by rubbing a plastic pen on a woolen sweater.
In a cumulonimbus cloud, the updrafts push up the positively charged ice particles and the downdrafts bring down the negatively charged droplets. At some point, the imbalance between the upper and lower charges needs to be re-adjusted by sending a bolt of electricity from the positive to the negative side of the cloud. This is known as intra-cloud lightning, and it is by far the most common one.
Cloud-to-ground lightning are less common. In some cases the lighting is released from the positive charged top (positive lightning). In others the negatively charged bottom “requests” electricity from the ground, causing a lightning flash (negative lightning).
Lightning strikes in planes happen about once a year for each plane and almost all the incidents result in no damage. The circuits are designed to avoid electrical failures, the fuel tank is sealed to prevent the triggering of sparks and the passenger area is well protected thanks to the Faraday effect.
Flight regulations
The Federal Aviation Administration (FAA) recommends pilots to “avoid by at least 20 miles (32 km) any thunderstorm identified as severe or giving an intense radar echo. This is especially true under the anvil of a large cumulonimbus”.
As we saw earlier, one of the main dangers of the cumulonimbus clouds is the large levels of turbulence within it. In some cases could even threaten the plane integrity, as it happened back in 1981 when a Fokker F-28 lost one of its wings shortly after entering one of these clouds.
But another risk is the strong upward and downward currents. For example, a landing plane going under a cumulonimbus cloud might first experience the strong updrafts and the pilot could try re-adjusting the wings to bring the plane down. If the plane suddenly enters into the downdrafts region, there is little time for the pilot to prevent a crash against the ground.
Takeoff and landing is so critical for these clouds that the so called Terminal Area Forecasts (TAFs), designed to forecast weather conditions at airports, only include cumulonimbus types in their cloud forecast. All other clouds represent a much less of a threat. If large cumulonimbus are in the airport area, planes might not be allowed to land at all.
That said, not all cumulonimbus clouds represent a threat. Smaller clouds or those still not in the mature stage might still be safe to go through. So don’t get too concerned if you see your plane passing close to one of these. Pilots know what they are doing!
Areas where cumulonimbus are most likely

Cumulonimbus clouds feed on hot moist air. The region with largest production of such is found on the Equator, or, more specifically, at the Intertropical Convergence Zone (ITCZ).
The ITCZ is the region when the winds from the Northern and Southern Hemisphere meet (or converge) and re-direct upwards to carry hot moist air. It is roughly along the Equator, but its exact position varies seasonally, shifting hundreds of kilometers towards the north or south.
In the northern and southern hemispheres, thunderstorms are also common during the hot summer days as this would be the peak for evaporation.
Forecasting cumulonimbus clouds

Air moisture can be predicted by global weather models, but this is not enough to predict clouds. The ~13 km resolution of these models is too coarse to resolve the details of a cloud, such as the updrafts and downdrafts of a cumulonimbus. Then, how to predict if at a moist location we should have a cumulonimbus or an altostratus cloud?
The cumulonimbus cloud forecast generated by NOAA and the Met Office (the one we use at turbli) uses a set of correlations to identify thunderstorm clouds. This process is known as convective parametrization. For example, when high moisture and vertical winds higher than about 0.5 m/s are found, then it can be assumed that there is a cumulonimbus.
Global models capable of resolving clouds are currently under development. These are known as convective-permitting models, since their ~2 km resolution does not require the assumptions on air movement needed in the coarser models. With the advances on computational power, these models will become a reality in the future, and we will likely see a much better prediction of thunderstorm clouds and precipitation.
References
Cotton W.R., et al., 2011. Cumulonimbus Clouds and Severe Convective Storms. International Geophysics, 99, 315-454. Chapter 8
McMurdie W.L. and Houze R.A., 2006. Weather Systems.Atmospheric Science, 313-373
Lane T.P., Sharman R.D., 2014. Intensity of thunderstorm-generated turbulence revealed by large-eddy simulation. Geophysical Research Letters, 41 (6), 2221-2227
U.S. Department of Transportation. Thunderstorms, Advisory Circular. Federal Aviation Administration, AC No: 00-24C
U.S. Department of Transportation. General Aviation Lightning Strike Report and Protection Level Study. Federal Aviation Administration, AR-04/13
Clark P., et al., 2016. Review. Convection-permitting models: a step-change in rainfall forecasting. Meteorological Applications, 23, 165-181
Cohen C., 2020. A Quantitative Investigation of Entrainment and Detrainment in Numerically Simulated Cumulonimbus Clouds. Journal of the Atmospheric Sciences, 57 (10), 1657-1674.