The Most Turbulent Regions in the World
Some regions in the world are more prone to turbulence than others. This should not be a surprise: just as there are regions more prone to rainfall, there should also be regions more prone to turbulence — a byproduct of wind instabilities that follows the global trends and distribution of these.
To understand turbulence, we must therefore understand how winds are distributed over the Earth. Let's start with that!
At the Equator, the intense solar radiation lifts large quantities of moist air, with such an impulse that part of it is deflected towards the poles. It does not go all the way straight to the poles, though. The Earth's rotation gradually changes the direction of this airflow until it forms a high velocity belt of eastward wind: the subtropical jet stream, located at about 20-30° latitude (Miami in the Northern hemisphere, São Paulo in the Southern hemisphere). Jet streams tend to generate a lot of turbulence, particularly in regions with high velocity differences, such as their boundaries or bends.
At higher latitudes, the same process of air rising and accelerating eastwards happens again, creating another stream known as the polar jet. Since the impulse of hot air rising is not as strong as in the Equator, this stream is much weaker than the subtropical one, making it more prone to instabilities and meandering. Although its location varies widely, it's typically located at 50-65° latitude (Oslo in the Northern hemisphere, Cape Horn in the Southern hemisphere).
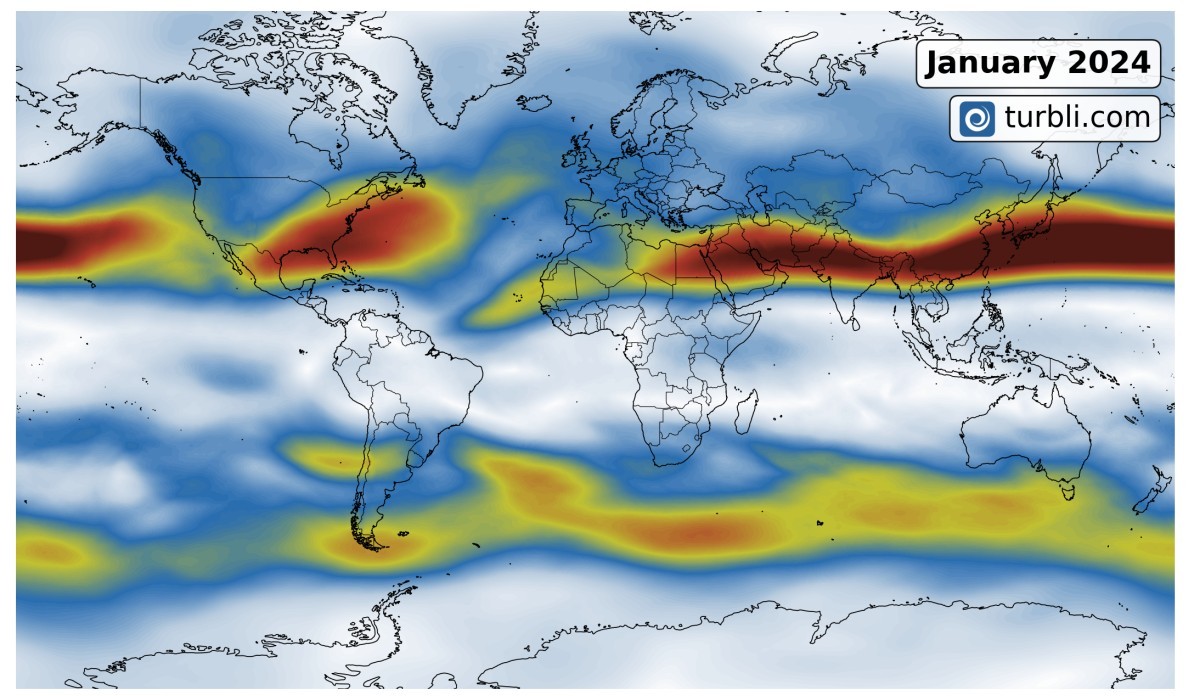
To stir things up, two factors come in to completely mess up the ideal weather circulation that we just explained: seasons and geography. Seasons induce shifts in latitude to the Intertropical Convergent Zone (ITCZ) and thereby to the jet streams. Winters increase the jet stream speed due to the higher temperature difference between the Equator and the poles, whereas summers see a decrease. Land masses provide uneven heating of the air, resulting in jet streams strengthening at different latitudes as they move around the Earth. The cherry on top is the tendency of large water masses to slowly “oscillate” in temperature, causing weather phenomena such as El Niño and La Niña, which again disrupt the global jet stream distribution.
The most turbulent areas tend to be those with both jet stream activity and tall mountain ranges, since the disturbances induced by mountains create further wind instabilities and thereby turbulence. Not just “random” turbulence. In many cases, a high-speed flow over mountains induces what is known as mountain waves that can propagate for hundreds of kilometers, and induce severe turbulence.
The rankings produced at Turbli show that regions such as the Andes, the Tibetan Plateau and the Rockies appear consistently in the most turbulent flight routes each year. Now we will dig into why this is the case.
The Andes
The Andes is the world's longest mountain range, running 7,000 km (4,300 mi) long with an average elevation of 4,000 m (13,000 ft). But what makes it a turbulent hotspot is its orientation. Mountain wave turbulence is more likely to develop when the mountain range is oriented perpendicularly to the wind direction, and this is exactly what happens with the Andes, running from North to South and exposed to eastward winds.
The subtropical jet stream, despite flowing at much higher altitudes than the Andes, plays a key role since it allows the waves to propagate higher up in altitude, reaching the cruising levels of planes. Severe turbulence can be generated at the wave tips when these “break”, or below the waves as these induce rotating air motions towards the ground (rotors). If the jet stream weren’t there, the waves generated would be pushed towards the ground and dissipate faster. In meteorology, the likelihood of the wave propagating upwards is typically estimated using the Scorer number and the Brunt–Väisälä frequencies.
The most bumpy area to cross the Andes is roughly at the level of Santiago de Chile, particularly during the winter months of June-August. In this area, the subtropical and polar jets are often superimposed, strengthening upper-level winds and shear in a region that already has all the ingredients for high turbulence.
The Tibetan Plateau
The Tibetan Plateau is often known as the “Roof of the World”. An adequate name, given its average height of 4,500 m (14,700 ft) over an area over 3 times the size of Texas.
The plateau contains many mountain ranges, most of which are not oriented perpendicular to the eastward airflows as the Andes are. This makes them less likely to induce mountain wave turbulence. However, the Tibetan Plateau acts as a giant thermal anomaly that locks the position of the jet stream to a very narrow range of latitudes. This is particularly prominent in winter, when the cold plateau creates a strong contrast with the warm Equatorial air, locking the jet's position and inducing some of the highest mean speeds in the world. This differs from the subtropical jet over the Andes, which is able to move over a much wider area due to the smoother and more mobile temperatures of the ocean.
Having the jet stream constantly meandering about the same latitude increases the likelihood of turbulence, particularly if this wind blows over highly irregular terrain. Even if mountain wave turbulence is not common across the entire plateau, there are regions that are actually prone to it, such as the plateau edges, parts of the Himalaya range, and the Longmen Mountains. This last one tends to induce high turbulence levels over Chengdu (China), a city that appears often in our turbulence rankings.
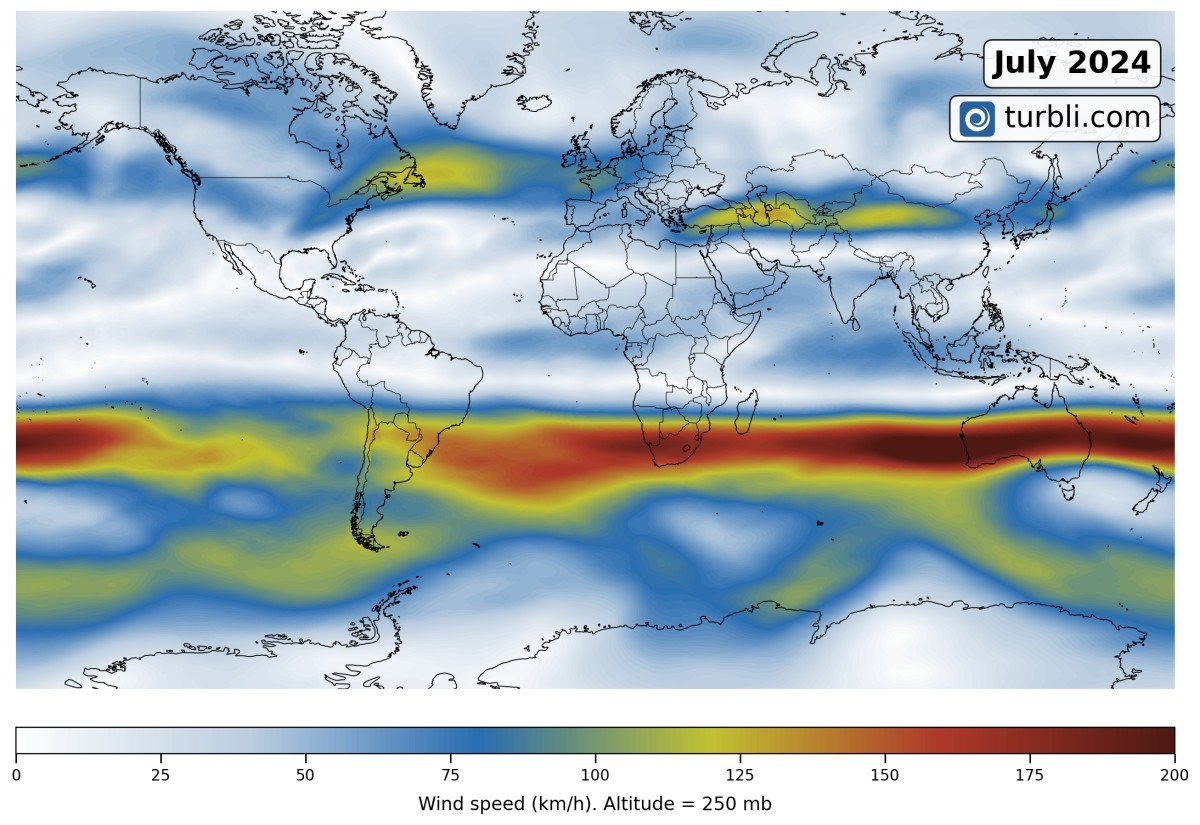
In summer, the jet stream over the Tibetan Plateau weakens significantly. This is because it warms up much more than the surrounding air, reducing the temperature difference with the Equator and displacing the jet to latitudes of 40° or higher.
Japan
Jet streams over Japan are so strong that they were actually discovered there by meteorologist Wasaburo Oishi in 1926. But he published his findings in Esperanto, resulting in minimal diffusion; so the world had to wait until 1947, when fighter planes from World War II reported strong air currents that triggered further research, this time published in English.
When looking at jet stream over Japan, we can regard the Tibetan Plateau as the trigger point, anchoring a very strong jet stream that crosses the entire China. When reaching the Chinese shore, the jet encounters the warm air brought by the Kuroshio current and the cold air coming down from Siberian Russia. This sharp contrast further strengthens the jet, pushing it over the southern part of Japan in winter and over the northern part in Summer. Cities like Osaka and Tokyo are common hubs for turbulence.
Since the Tibetan Plateau pushes the summer jet stream very high up in latitude, this causes frequent interference with the polar jet over Japan, something that creates additional turbulence in the summer months.
The Rockies
In the US, the jet stream approaching from the Pacific enters roughly at the latitude of Vancouver. This jet is no longer locked to a narrow range of latitudes, as it was over China and Japan. After flowing over the Pacific, the ever-changing sea surface temperatures have increased its mobility and allowed it to meander in much higher amplitudes. These meanders (Rossby Waves) have a strong impact on turbulence.
As the Rossby waves approach the US East Coast, the Rockies can further amplify them and force the jet to take steep turns that get “locked” into a fixed position, rather than continuing to propagate eastwards. In meteorology, this is known as “blocking”, and it is a very common phenomenon over US that results in frequent cold spells and heat waves that can last for days or weeks.
Blocking patterns tend to contain a lot of turbulence due to the sharp changes in wind direction and speed. One particular source are jet streaks: high velocity regions within the jet itself that generate a lot of turbulence at their entry and exit regions. The Rockies generate additional turbulence by inducing mountain waves in areas such as Sierra Nevada, and mechanical turbulence over the entire range. Denver, located downstream of Mount Elbert (highest peak in the Rockies), is a famous turbulent hotspot.
The Intertropical Convergence Zone (ITCZ)
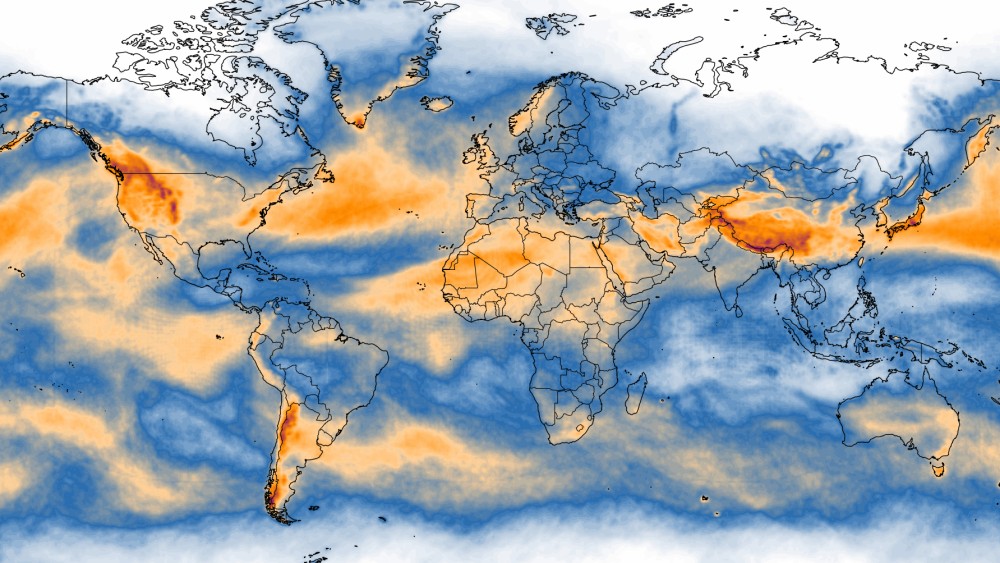
So far, we have discussed mostly jet streams and mountain wave turbulence. Thunderstorms are another important turbulence generator, and perhaps the most difficult to navigate for pilots due to their quick development compared to large get streams. Summers bring thunderstorms to each hemisphere, but the highest density is always found over the Intertropical Convergent Zone: a belt around the Earth located roughly around the Equator, but that undergoes substantial changes in latitude over the seasons: moving North in July, and South in January.
Inside a thunderstorm cloud (cumulonimbus cloud), severe or extreme turbulence can be found at the interface between the updrafts carrying moist air and the downdrafts pouring rain and ice. This is the last place an airliner wants to be, and for this reason, pilots are advised to maintain a lateral distance of 20 nm (32 km) from large thunderstorm clouds. This is a challenge, since it's not easy to find a way around many cloud formations that are developing quickly.
An additional challenge for aviation is the difficulty in predicting thunderstorm turbulence. Current turbulence forecasts with ~13 km resolution simply cannot predict what happens inside a cloud of 2-3 km diameter. Instead, pilots rely on dedicated thunderstorm forecasts, ground radar, onboard radar, and satellite imagery.
Summing up
After reading this article, you might still hit the worst turbulence of your life when cruising over the smooth Siberian skies, or you might experience a perfectly calm flight over the Tibetan Plateau. Turbulence, like weather, is fast-changing. Here we focused on the averaged turbulence conditions, which, like the relatively stable climate patterns, do not imply that every day will be same.