
Climate Change, Expected to Increase Flight Turbulence up to 130%
Commercial aviation produces about 2.5% of the world's CO2 emissions. Today, it seems that the Earth is ready to strike back. Recent studies predict increased levels turbulence for the upcoming years, threatening the aviation industry.
To find out what is really happening, we dig into the research carried out in this area.
Predicting turbulence for year 2080
If turbulence forecast are only available up to 2 days in advance... how can you predict what will happen in 60 years from now?
The answer is simple: we can't. The models used for long-term weather forecasting are much more simplified than the ones used for short-term. They do not attempt to predict turbulence for a specific place at a given time. Not even for a specific year. These models are used for predicting trends. With a lot of uncertainty, yes, but these trends are a key to understand and prepare ourselves for the future.
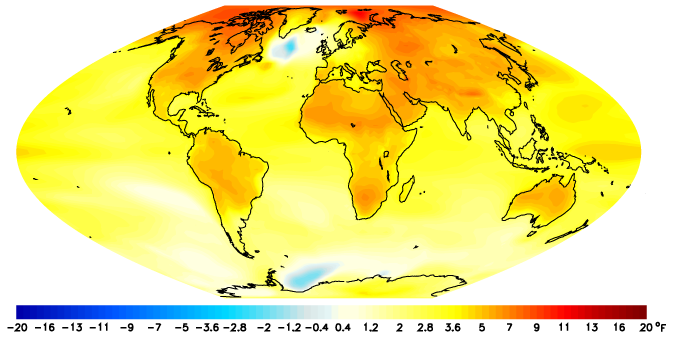
Some of the models used to predict long-term weather patterns and turbulence are the GFDL and the HadGEM2. The GFDL was created for the International Panel of Climate Change, and has already shown good predictions for droughts, hurricanes, sea level rises and other weather phenomena.
Some background (1): global circulation
The Equator is the Earth's region with largest dose of solar heat. Large quantities of hot air raise here and then spread towards the north and south.
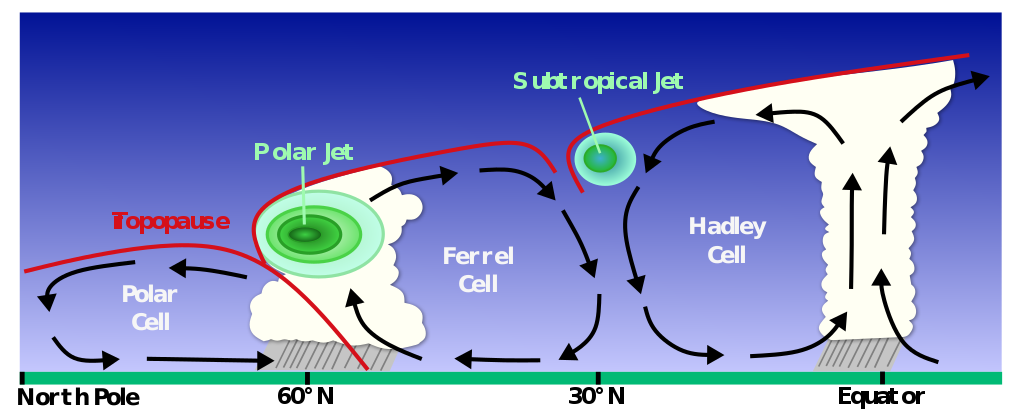
But this air doesn't travel directly to the poles. The Earth's rotation, the Coriolis force, rotates it little by little towards the east. At some point, the air flow is completely diverted towards the east and forms a belt around the Earth's atmosphere: the subtropical jet stream. This first air circulation is known as the Hadley cell. The Ferrel and Polar cells follow a similar process, forming the polar jet stream.
Some background (2): jet streams
Most on the research done on climate change induced turbulence focuses on jet streams. As we saw in the previous section, these streams are nothing new. They have been flowing along the atmosphere for as long as we know, and have always represented a hazard for turbulence.
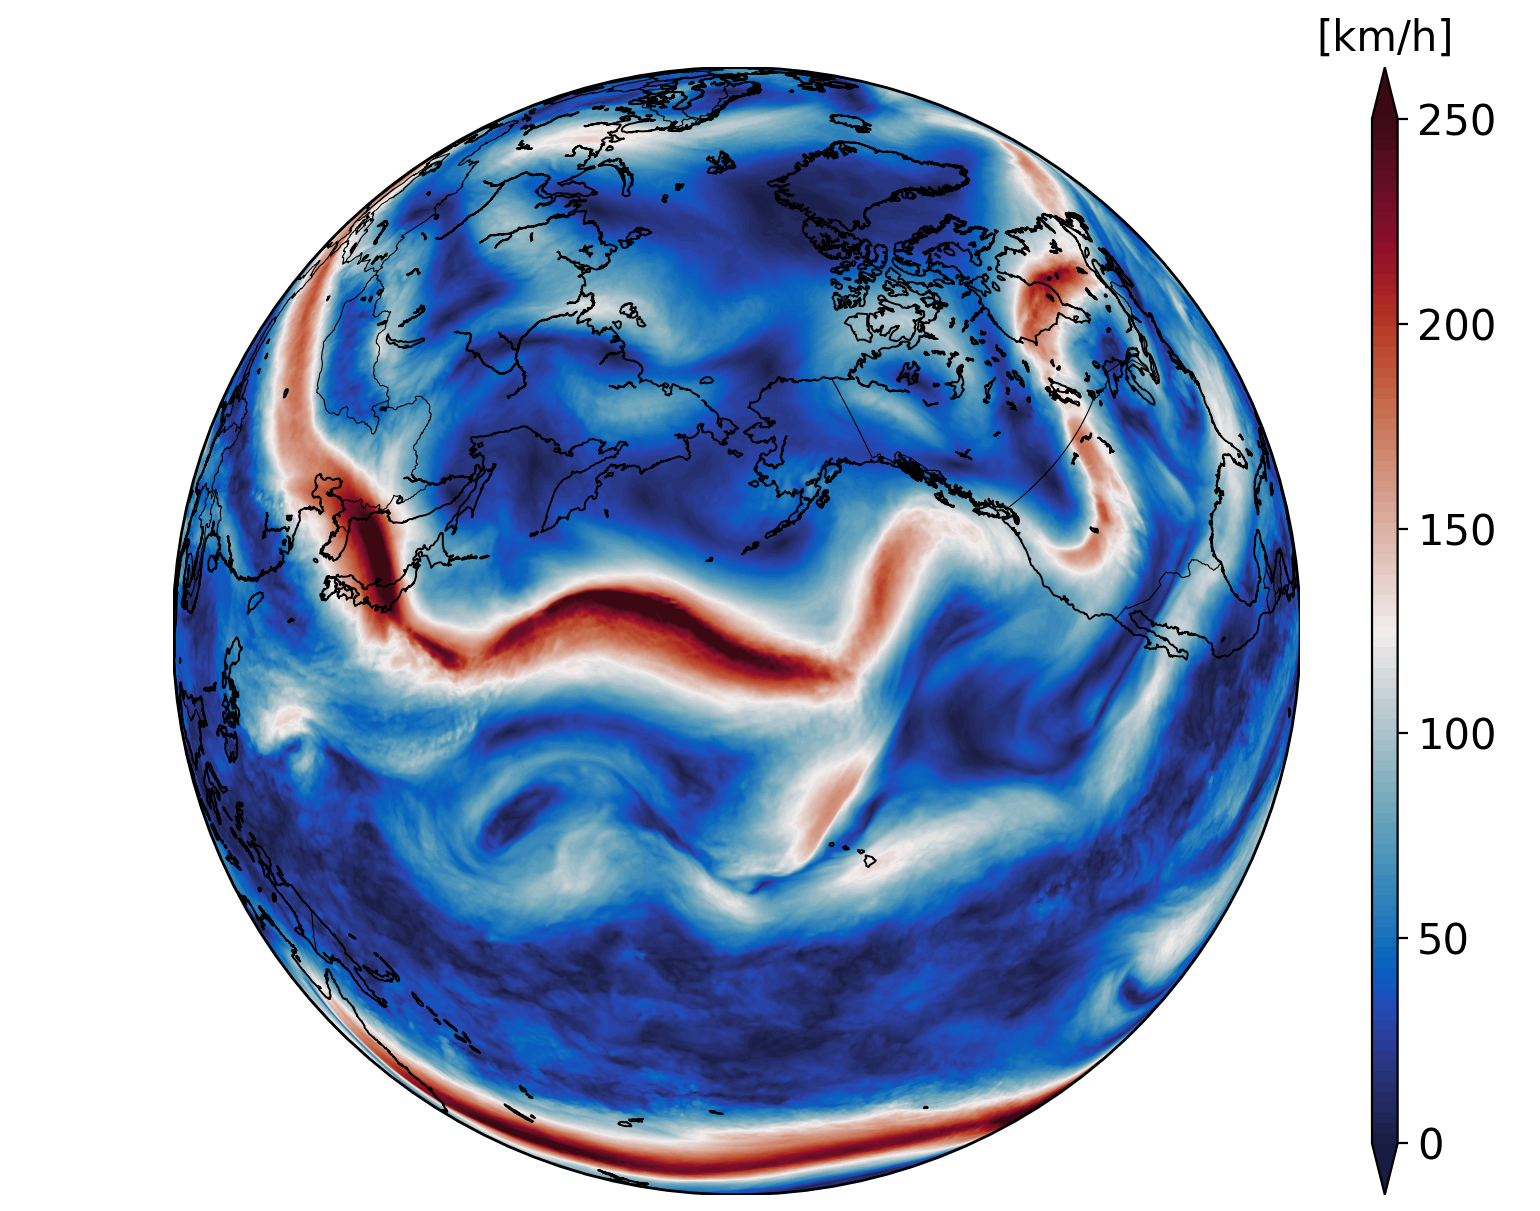
Apart from the Coriolis force, jet streams are also driven by the temperature gradient between the equator and the poles. The larger the gradient, the stronger the jets and the more turbulence.
But why?
A hotter Equator means more hot air rising and being pushed towards northern and southern hemispheres. This is specially true if these regions become cooler and reduce their amount of hot rising air which could "counter" the air masses coming from the Equator. So, the larger the temperature difference, the easier for the Equator to push out it's hot air and create stronger jet streams. This is also the reason why jet streams are strongest during the winter, and weakest in summer.
Jet streams, getting stronger
The simulations run by different researches suggest that in the upcoming years the jet streams are going to get stronger. This is why:
The troposphere, the first layer of the atmosphere, will continue to warm up every year due to the CO2 emissions. Most of this heat is absorbed by the oceans. As a result, the floating ice in the Artic melts fast, leading to an accelerated warming in this region. The Antartic is also loosing ice, but since this one rests on top of the Antartic continent, it melts at a lower rate. But wait.. if the Artic is getting hotter faster, this should make the temperature difference between the poles and equator lower, leading to weaker jet streams, right? No!
The stratosphere, the second layer of the atmosphere, is expected to continue cooling, specially at the poles. In the upper stratosphere, the increase of CO2 leads to cooling since this gas increases the emission of long-wave radiation to space. Cooling of the lower stratosphere is attributed to the reduction of the Ozone layer, which stores less and less energy from UV rays and lets them through to the troposphere.
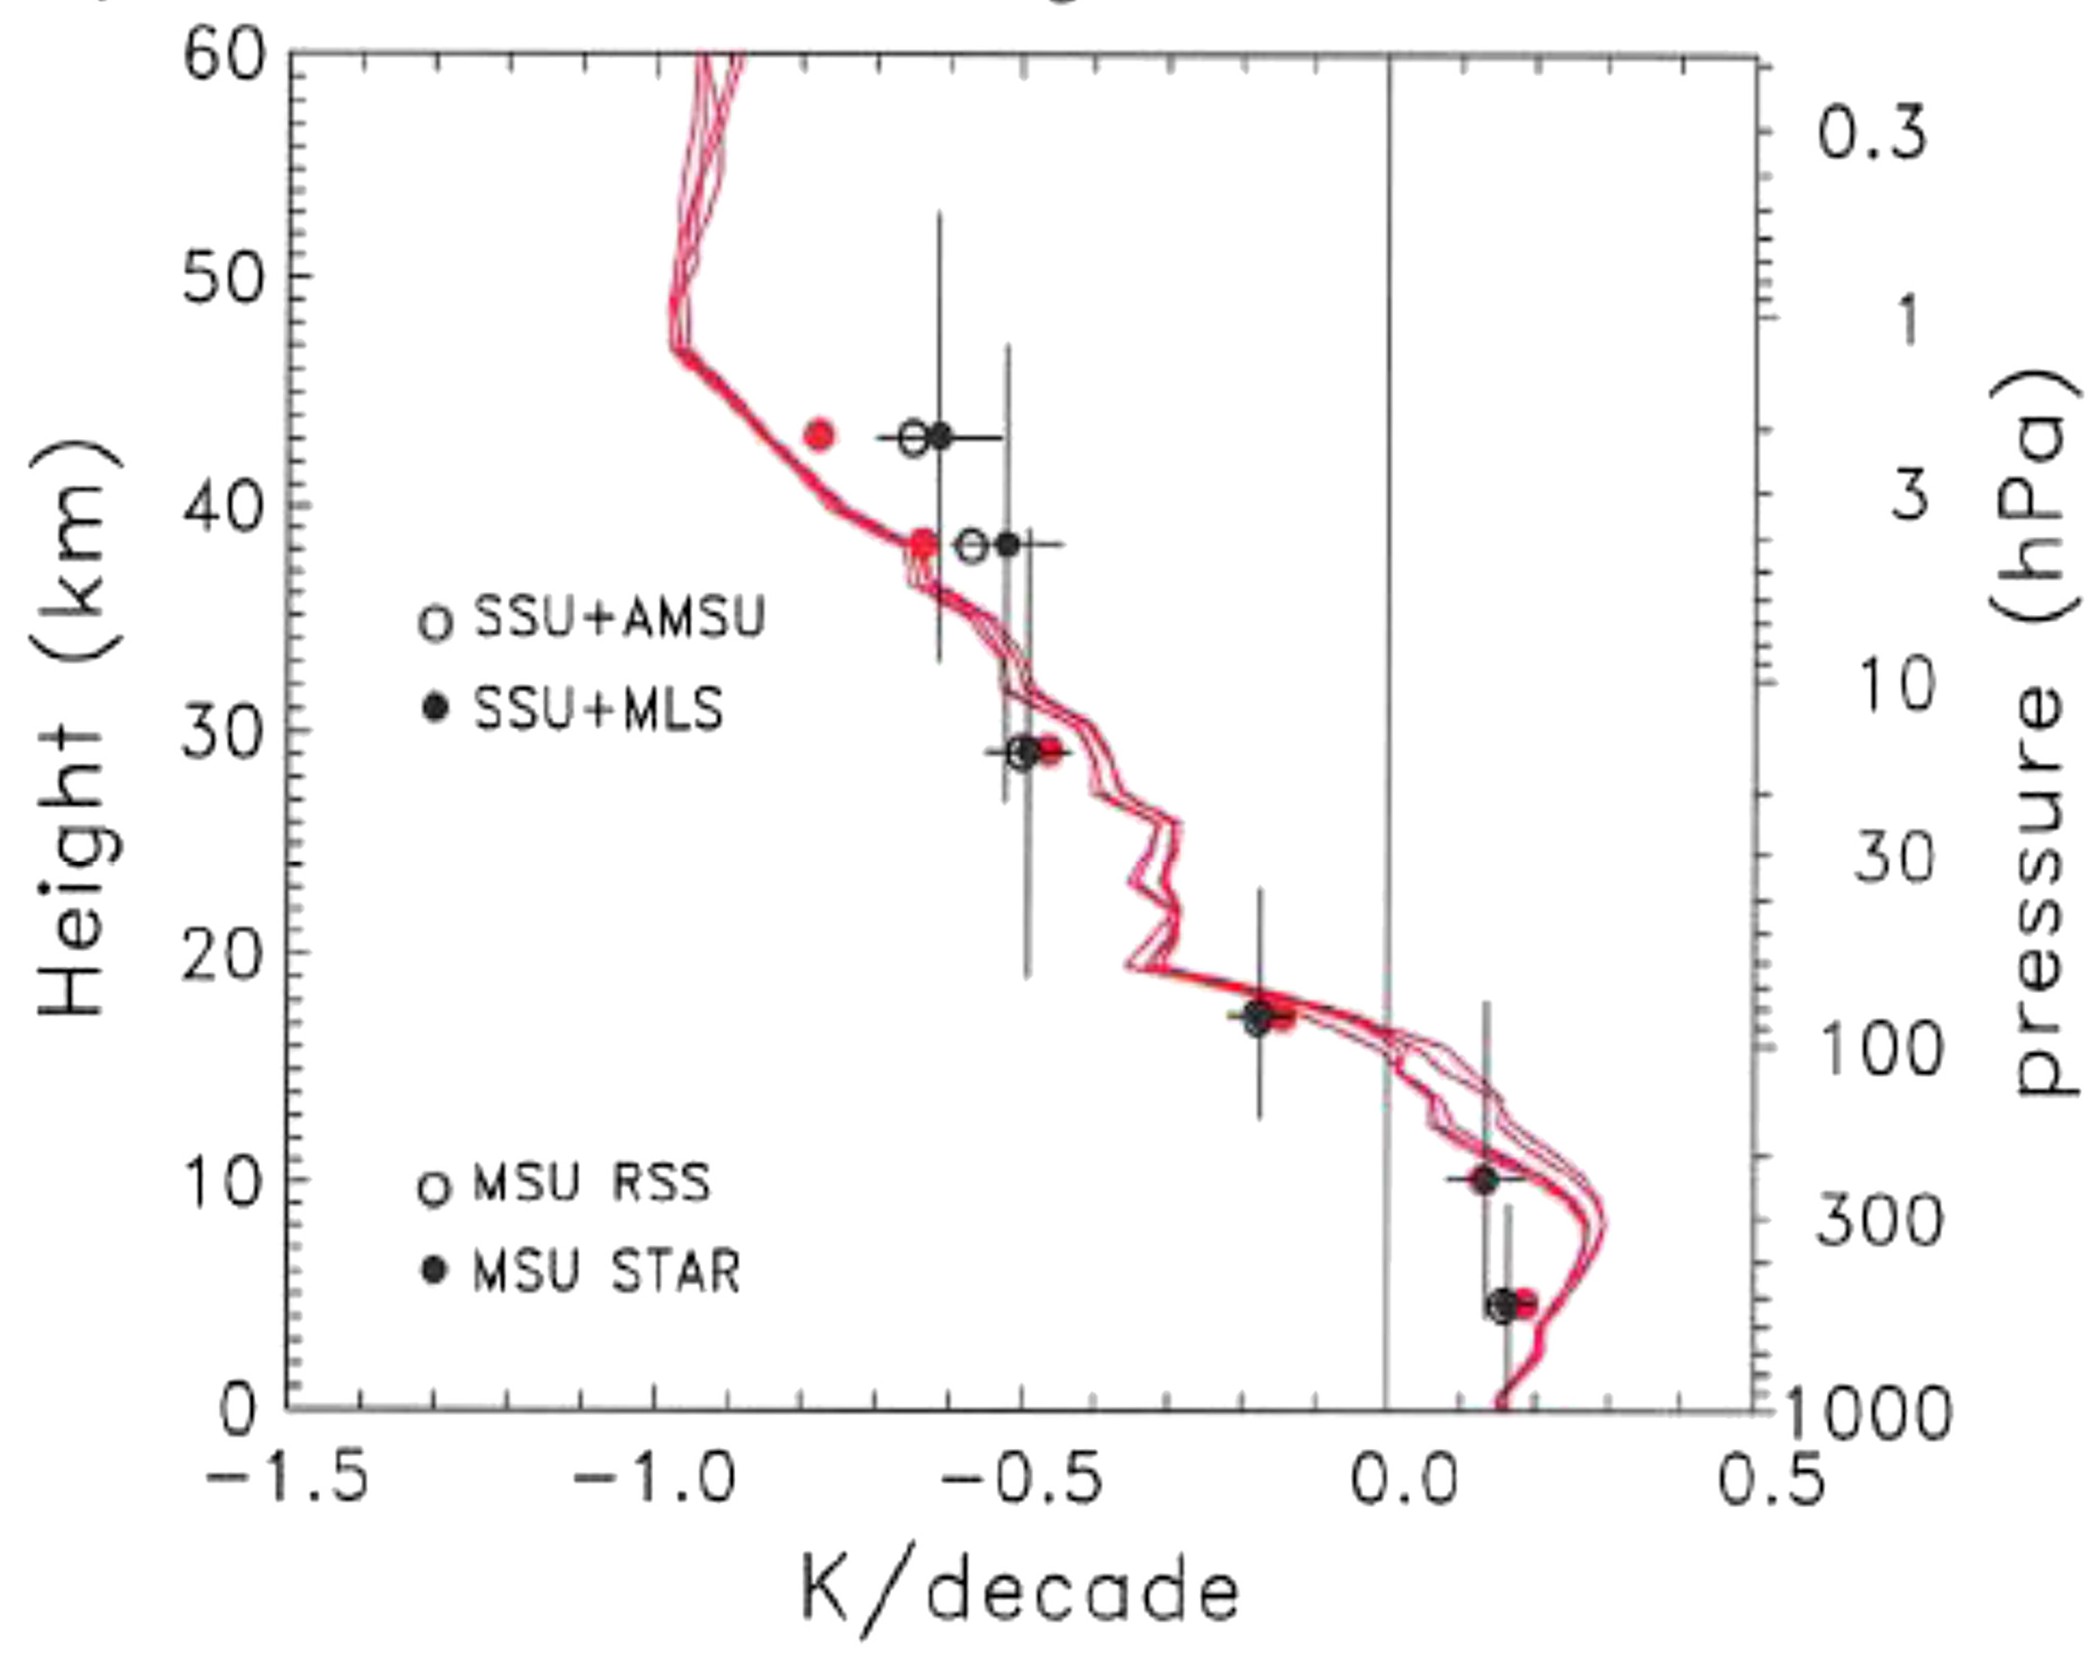
Thus, considering the mean vertical temperature (troposphere + stratosphere), the temperature gradient between the poles and the equator increases, leading to stronger jet streams and more turbulence.
Another important point is that reanalysis weather data from the ERA-40 already shows that the turbulence has been increasing since 1958. Thus, model simulations seem to confirmed by these observations.
About 35% more turbulence worldwide
The world’s average increase in turbulence by 2080 is estimated to be about 35 % for all types of turbulence (Table 1 in Storer L.N. et al., AGU).
• Light turbulence: + 38 %
• Moderate turbulence: + 32 %
• Severe turbulence: + 35 %
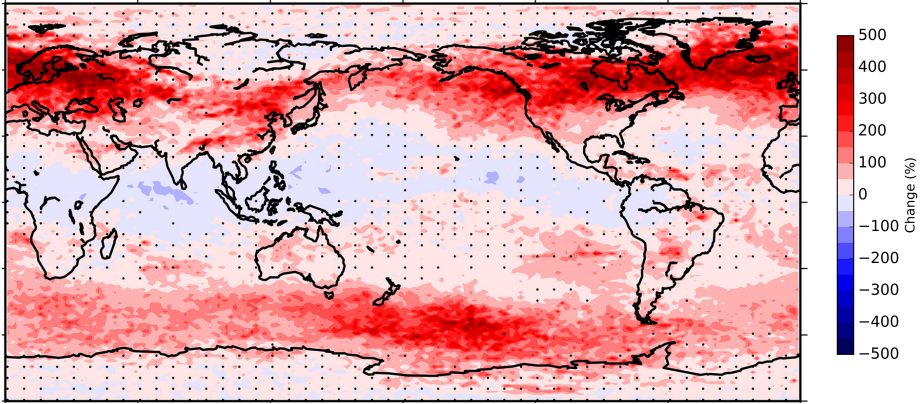
This predicted increase should not be taken as an exact measure. It’s a combined result of different weather models and turbulence correlations, all of which predicted slightly different values. The main point is that they all predicted an increase in turbulence.
The North Atlantic, largest increase in turbulence
The average increase of about 35% in turbulence was for the entire world. However, each region of the world will have its specific development. The region which will be hit the hardest is the North Atlantic, where the increases in turbulence are estimated to be (Table 2 in Storer L.N. et al., AGU):
• Light turbulence: + 61 %
• Moderate turbulence: + 109 %
• Severe turbulence: + 134 %
Other regions of the world are better off, specially Australia, which will see a much smaller increase in turbulence (Table 2 in Storer L.N. et al., AGU):
• Light turbulence: + 14 %
• Moderate turbulence: + 24 %
• Severe turbulence: + 43 %
Is all the stratosphere really cooling?
The key to support that the turbulence is going to get stronger is the larger stratospheric cooling in the poles. Without it, the larger temperatures of the troposphere in the poles could make the jet streams weaker.
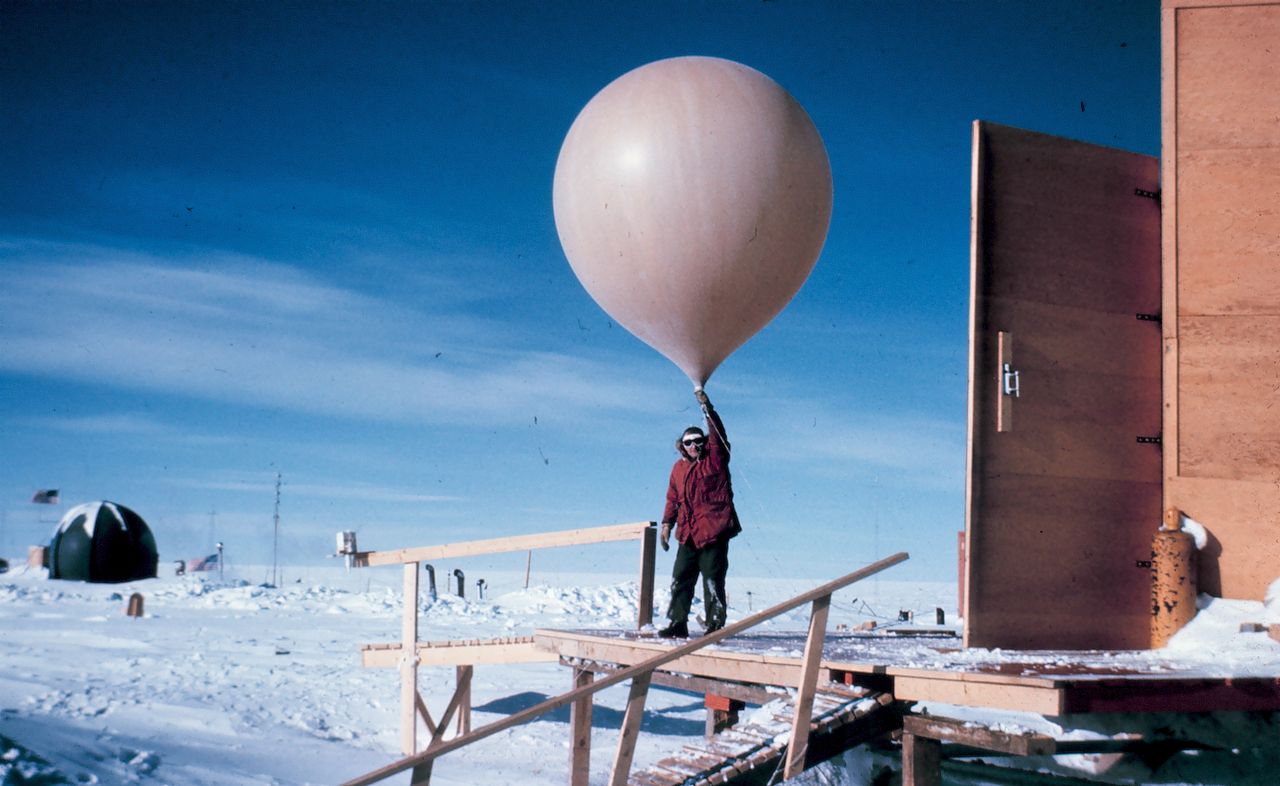
Recent studies analyzing radiosondes data from weather balloons argue that for the for the past 20 years the lower stratosphere is not cooling, but warming. This change is attributed to the gradual recovery of the Ozone layer, a result of the drastic reduction of man-made Ozone depletion particles. If this warming trend continues, the predicted strength of jet streams and turbulence might change.
To sum up
Turbulence is predicted to increase as the CO2 emissions continue to grow. So far only the jet stream effects have been studied, projecting increases of turbulence up to +134 % in the North Atlantic. On the other hand, other studies show changes in the stratosphere which might reduce the weather patterns triggering turbulence. We will keep you updated on it!
References
International Energy Agency, 2020. Aviation, IEA, PARIS
Williams P.D., 2017. Increased Light, Moderate, and Severe Clear-Air Turbulence in Response to Climate Change. Advances in Atmospheric Sciences, 34, 576–586.
Storer L.N., Williams P.D., Joshi M.M., 2017. Global Response of Clear-Air Turbulence to Climate Change. Geophysical Research Letters, 44 (119), 9976-9984.
Jaeger E.B., Sprenger M., 2007. A Northern Hemispheric climatology of indices for clear air turbulence in the tropopause region derived from ERA40 reanalysis data. Journal of Geophysical Research: Atmospheres, 112, D20106.
Philipona R., et al., 2018. Radiosondes Show That After Decades of Cooling, the Lower Stratosphere Is Now Warming. Journal of Geophysical Research: Atmospheres, 123 (22), 509-522.
Randel, W.J., et al., 2017. Troposphere-Stratosphere Temperature Trends Derived From Satellite Data Compared With Ensemble Simulations From WACCM. Journal of Geophysical Research: Atmospheres, 122 (18), 9651-9667.

