The Safest Transport Modes, Ranked by Statistics From 10 Years of Data
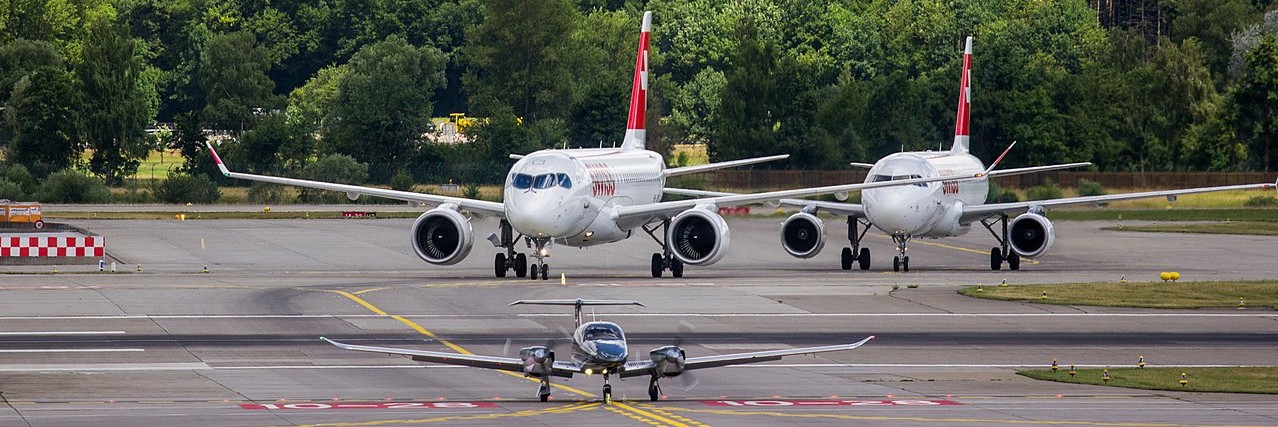
We have all heard that flying is very safe compared to other means of transport. Still, many people find it more frightening than a short car ride. This is an understandable behavior: we did not evolve to feel comfortable at 38,000 ft, at the mercy of an unknown pilot, sometimes during inclement weather.
In this article we try to show as clearly as possible the reality of how safe flying really is. We will see that there are some surprises, such as some flights being much more dangerous than others.
10 years of US transport safety data
The analysis is done for the US only, using the data provided by the Bureau of Transportation Statistics (BTS). Since transportation safety changes over time, we selected the most recent 10 years with available data: 2010-2019.
The vehicles analyzed are presented below:
Other means of transport such as freight boats, recreational boats, light rail, etc. are not included due to the lack of data to perform an adequate analysis.
For interested readers, all the assumptions made when data was missing have been places in an Appendix at the end of the article.
Fatalities
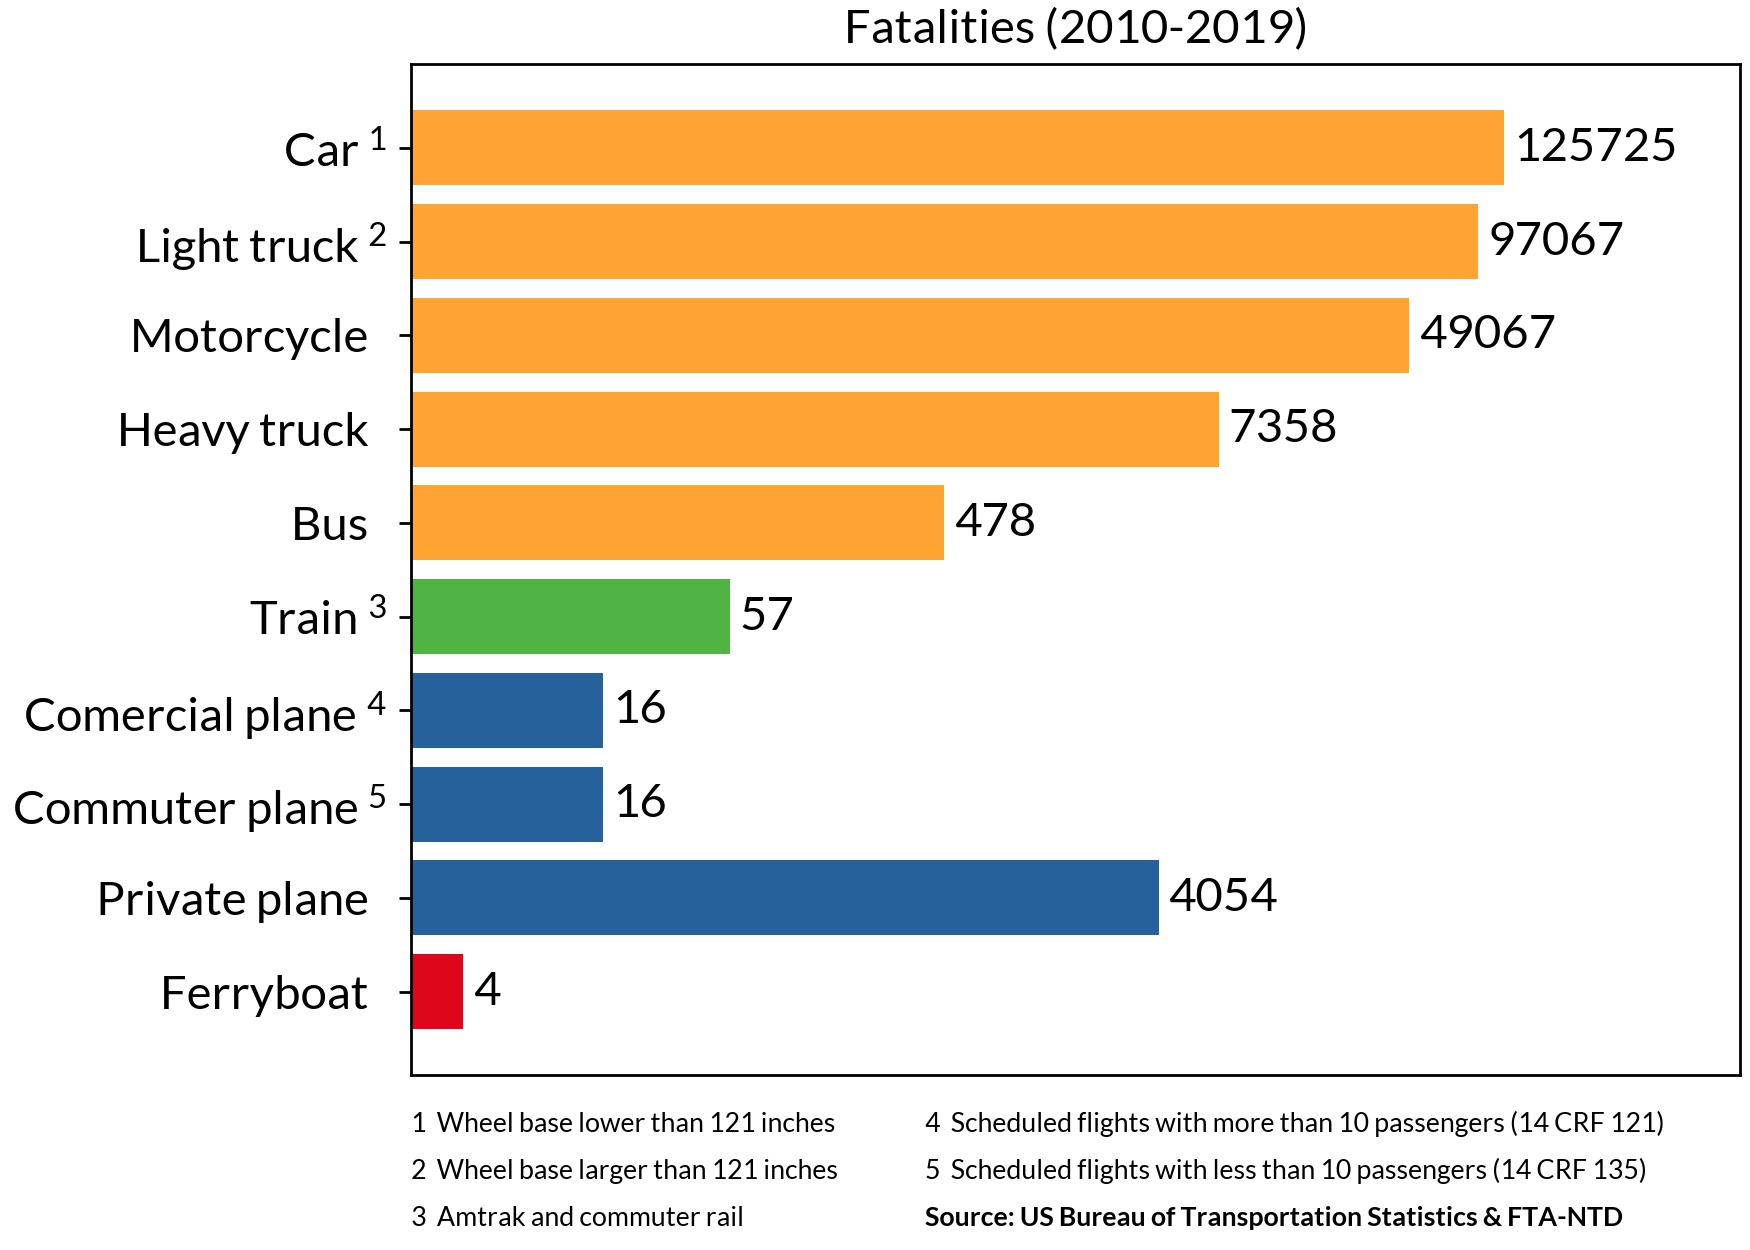
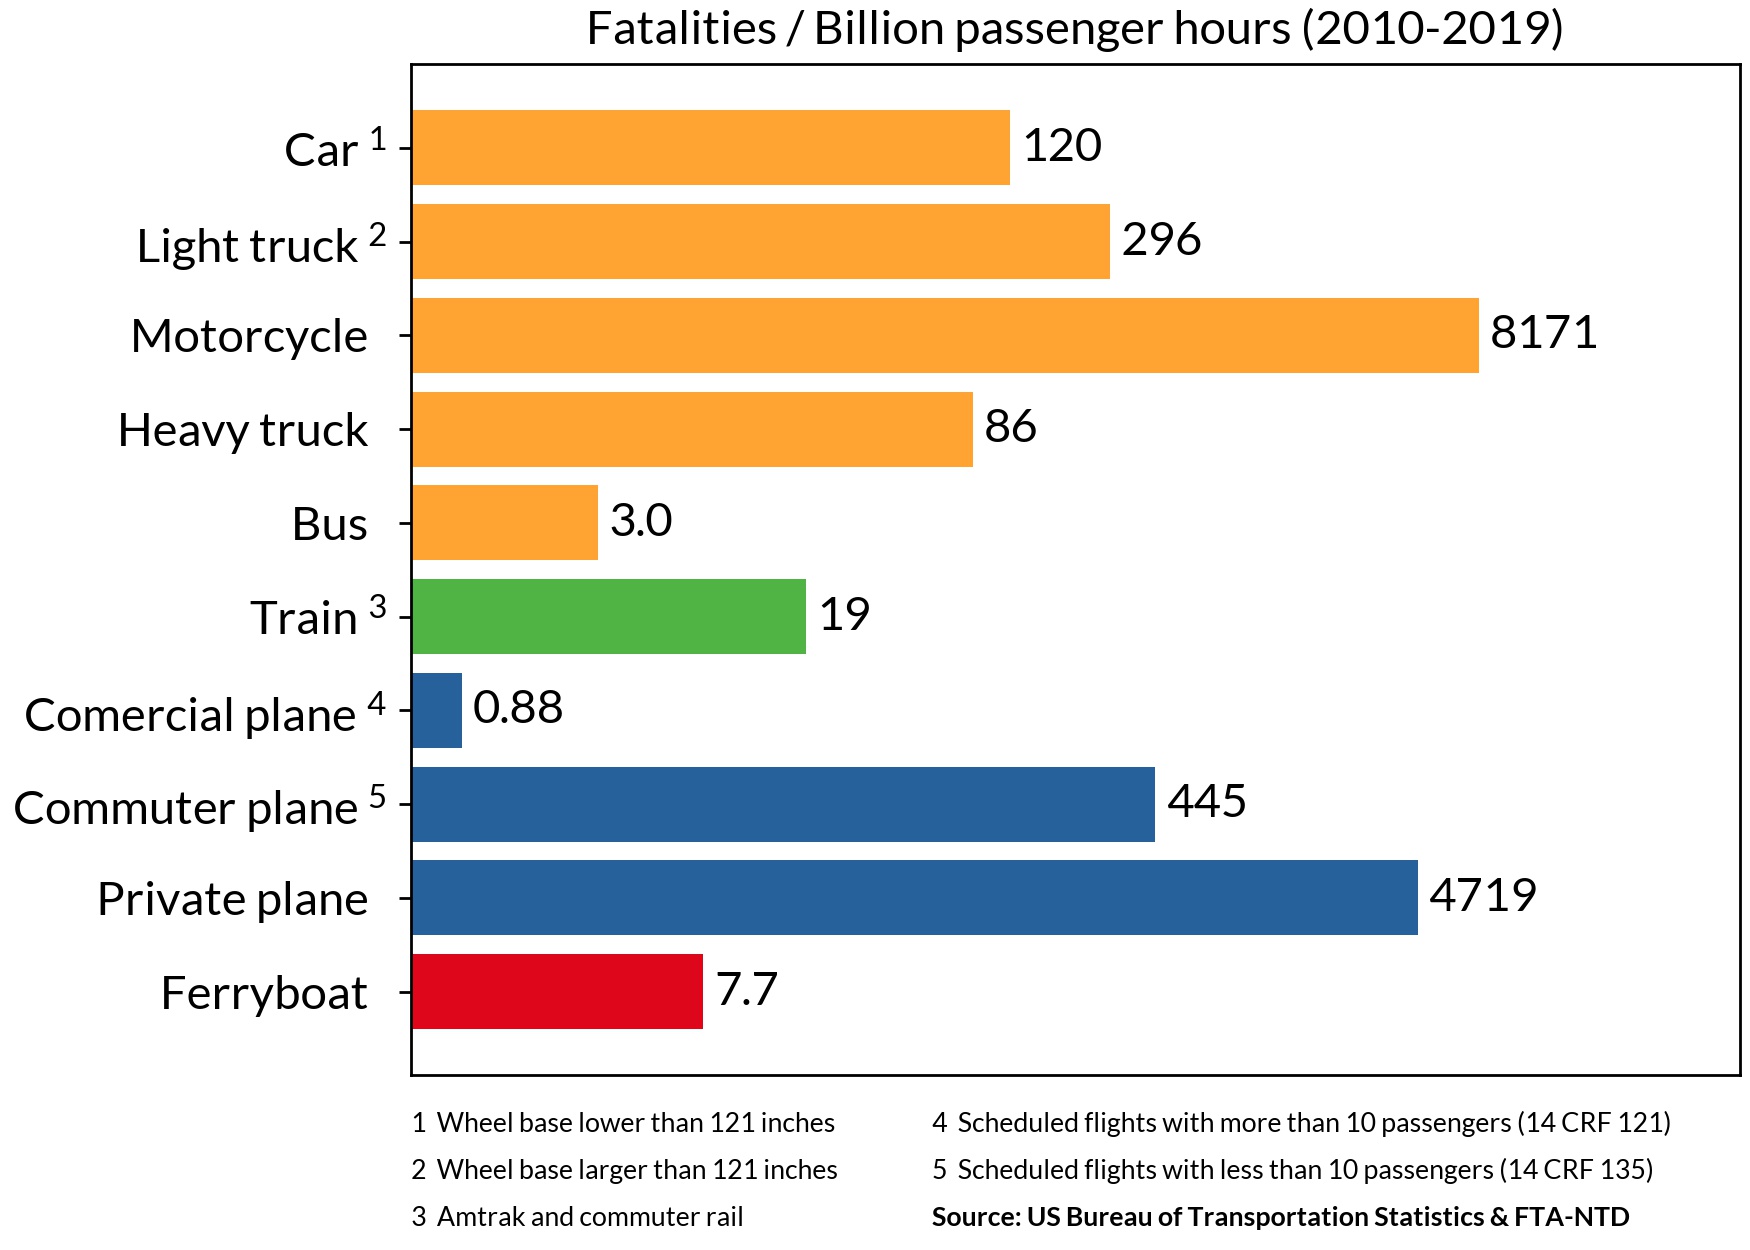
The fatalities presented here only include the occupants of the vehicles. Deaths from pedestrians, cyclists, trespassers, etc are not included. To improve the visualization, the figures are shown in logarithmic scale, meaning that the bars change size with by factors of 10 rather linearly.
Looking at the fatalities alone, we can clearly see that land vehicles accumulate the largest share. Train, planes and ferryboat have much lower numbers in comparison. Private planes have a striking difference with commercial or commuter planes, reaching 100 times more fatalities.
The fact that only 16 people have died in commercial aviation already shows how safe this transport is. Between this period, there have been more than 100 million plane departures in the US.
Normalizing the data
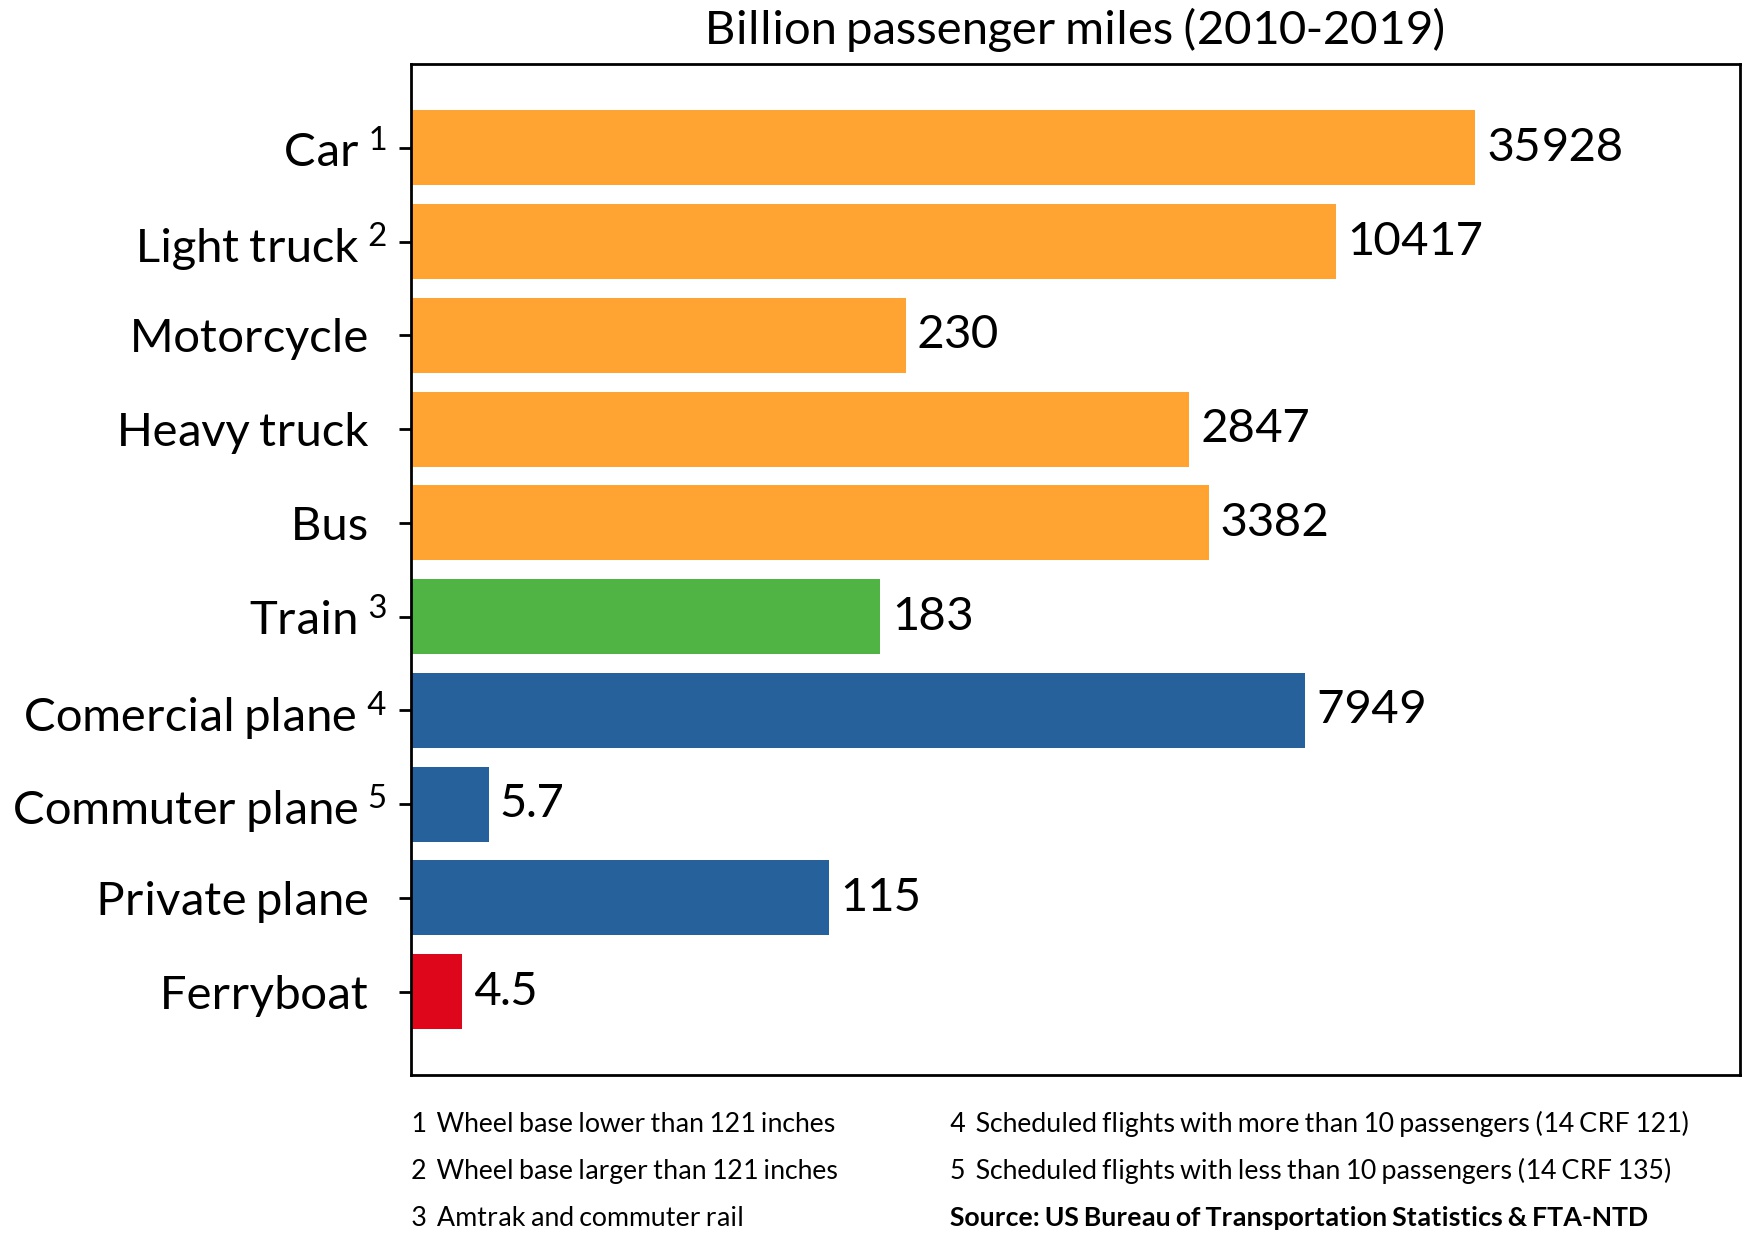
The total number of fatalities is not a good measure to determine if one means of transport is safer than another. This is because those used more often can accumulate more fatalities than those used less. By dividing (normalizing) the number of fatalities by different factors, a better comparison can be achieved.
In this article we will show the fatalities data normalized by passenger miles and passenger hours.
Fatalities by passenger miles
A common normalization factor for transport are the vehicle miles. That is, the sum of all miles traveled by all the vehicles of a specific means of transport over a period of time.
Vehicles miles = Sum of all miles traveled by all vehicles
While this factor gives as an idea of how much each transport type is used, it does not take into account that some vehicles carry many more passengers than others. This should be taken into account since, to transport 1000 people from point A to point B, many car trips would be needed, increasing the risk compared to train or planes. This leads to the normalizing factor of passenger miles.
Passenger miles = Vehicle miles x Passengers per vehicle
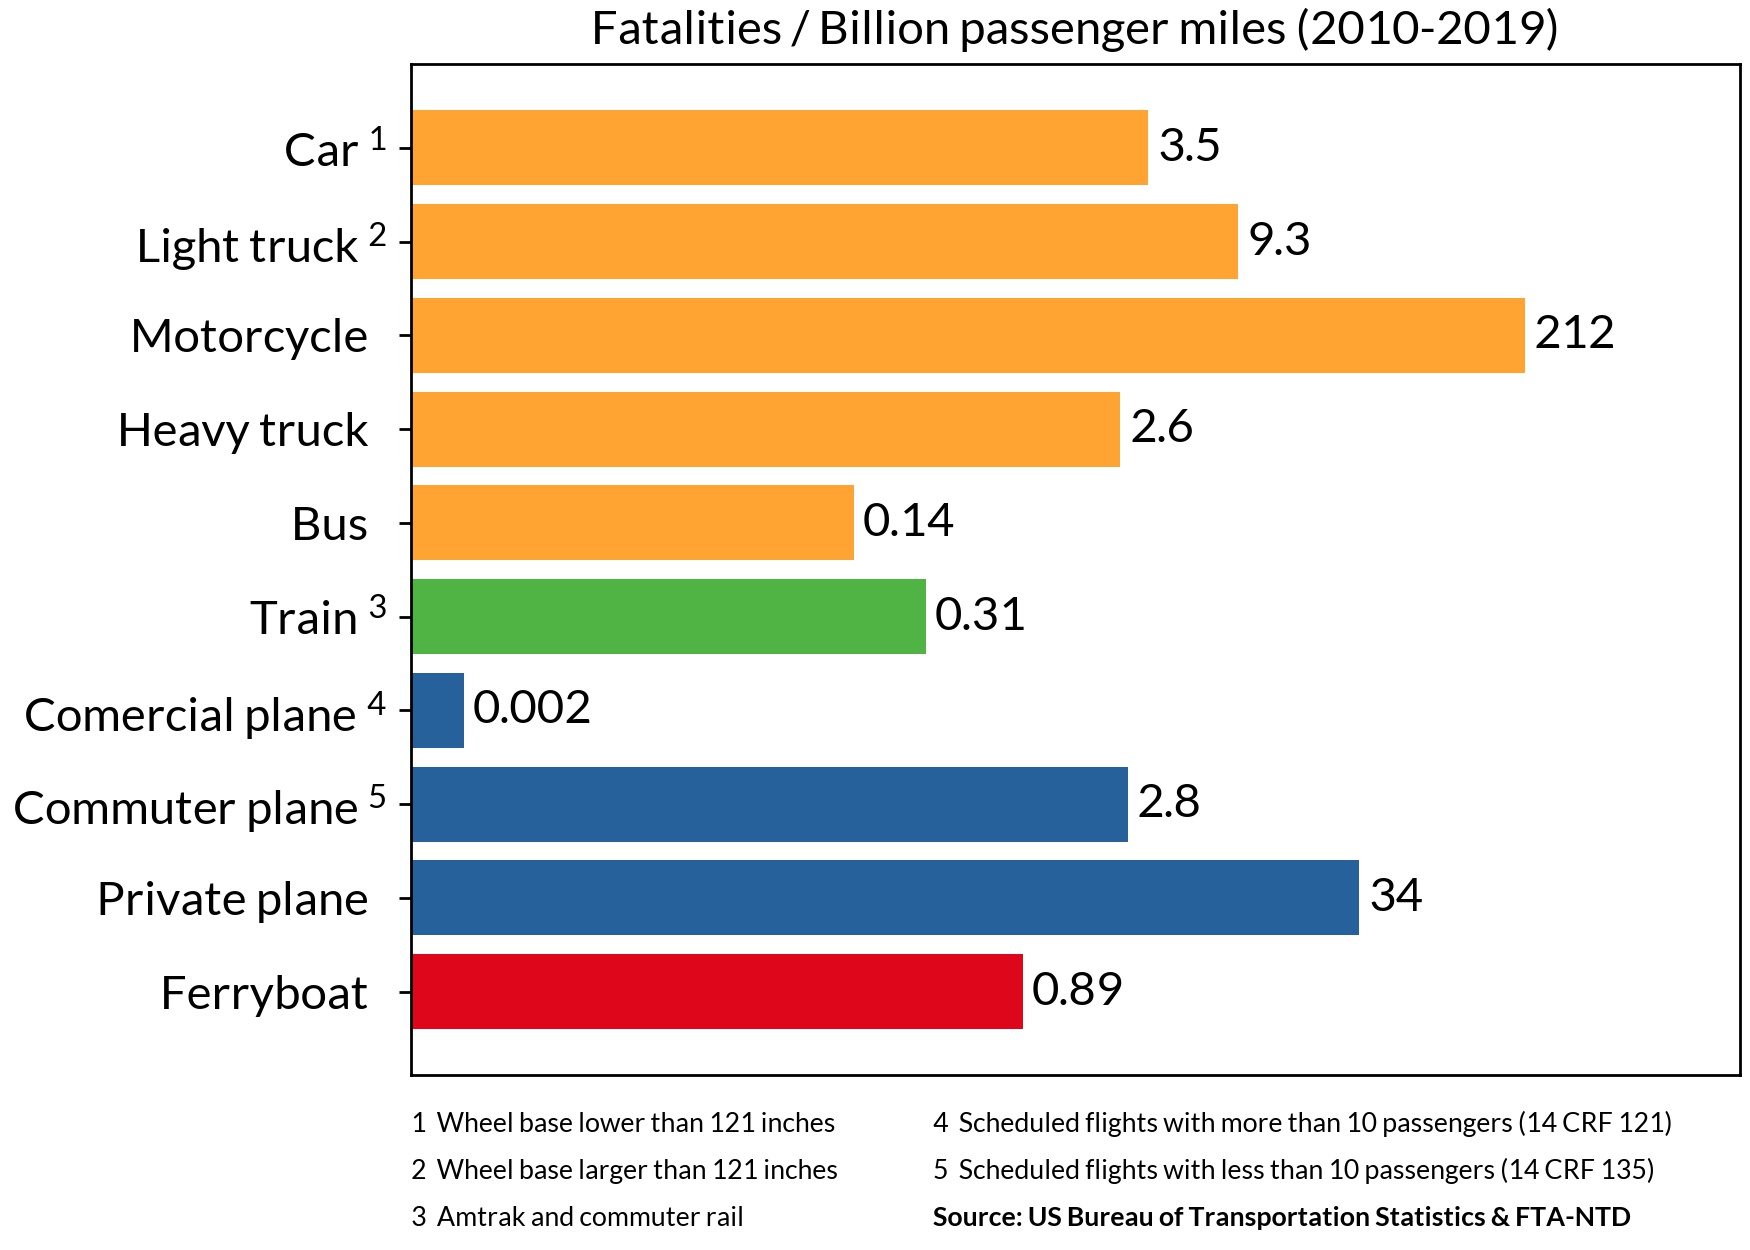
If you were to travel a given distance from point A to B, the fatalities per passenger miles shows which transport is the safest.
Looking at the data, we can see that motorcycles are by far the most dangerous transport. Bus, train and ferryboats appear much safer. Flying has long been considered as very safe too, but here we can see that not all flight modes are equal. Flights done with private owned planes are 10 times more dangerous than cars!
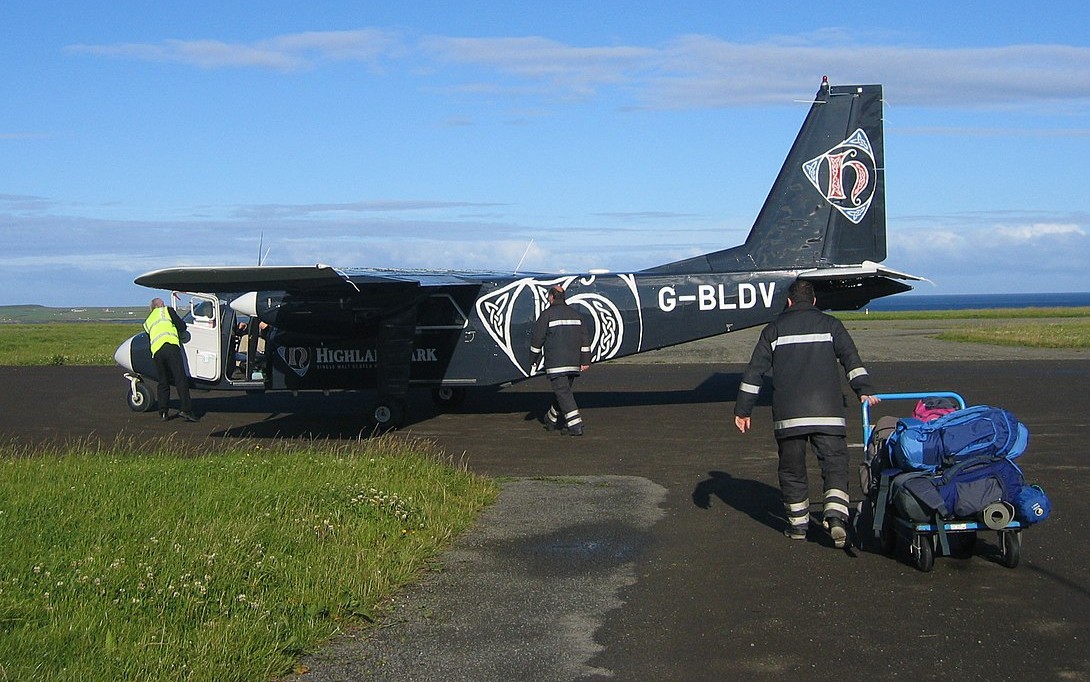
Despite having only 16 deaths over the past 10 years, commuter flights also show a high fatality rate. This is due to their low passenger miles, meaning that this transport is not as used as the larger commercial flights.
If you don’t take commuter flights and don't own a private plane, then I have good news for you: commercial flights are the safest means of transport! They are 1,700 times safer than car, and 100,000 times safer than motorcycle.
Fatalities by passenger hours
Another useful metric is the passenger hours. That is, the sum of all hours traveled by all vehicles of a transportation means.
Passenger hours = Vehicle hours x Passengers per vehicle
This factor can be used to compare how risky it is to sit a fix number of hours in different transports. For example, 5 hours in a motorcycle vs 5 hours in a plane. Of course, the plane will take you for a longer distance than the motorcycle, but it’s still a useful metric to compare the safety of one situation to another.
The results are similar to those from passenger miles. Motorcycle maintains the position as least safe transport, whereas bus, train and ferryboat continue with low numbers
Since planes are much faster than land vehicles, the total hours spent on them are lower when considering the same amount of miles. Therefore, commercial flights now appear "only" 130 times safer than car when using this metric, and private flights 40 times more dangerous.
Are commuter flights as risky as cars?
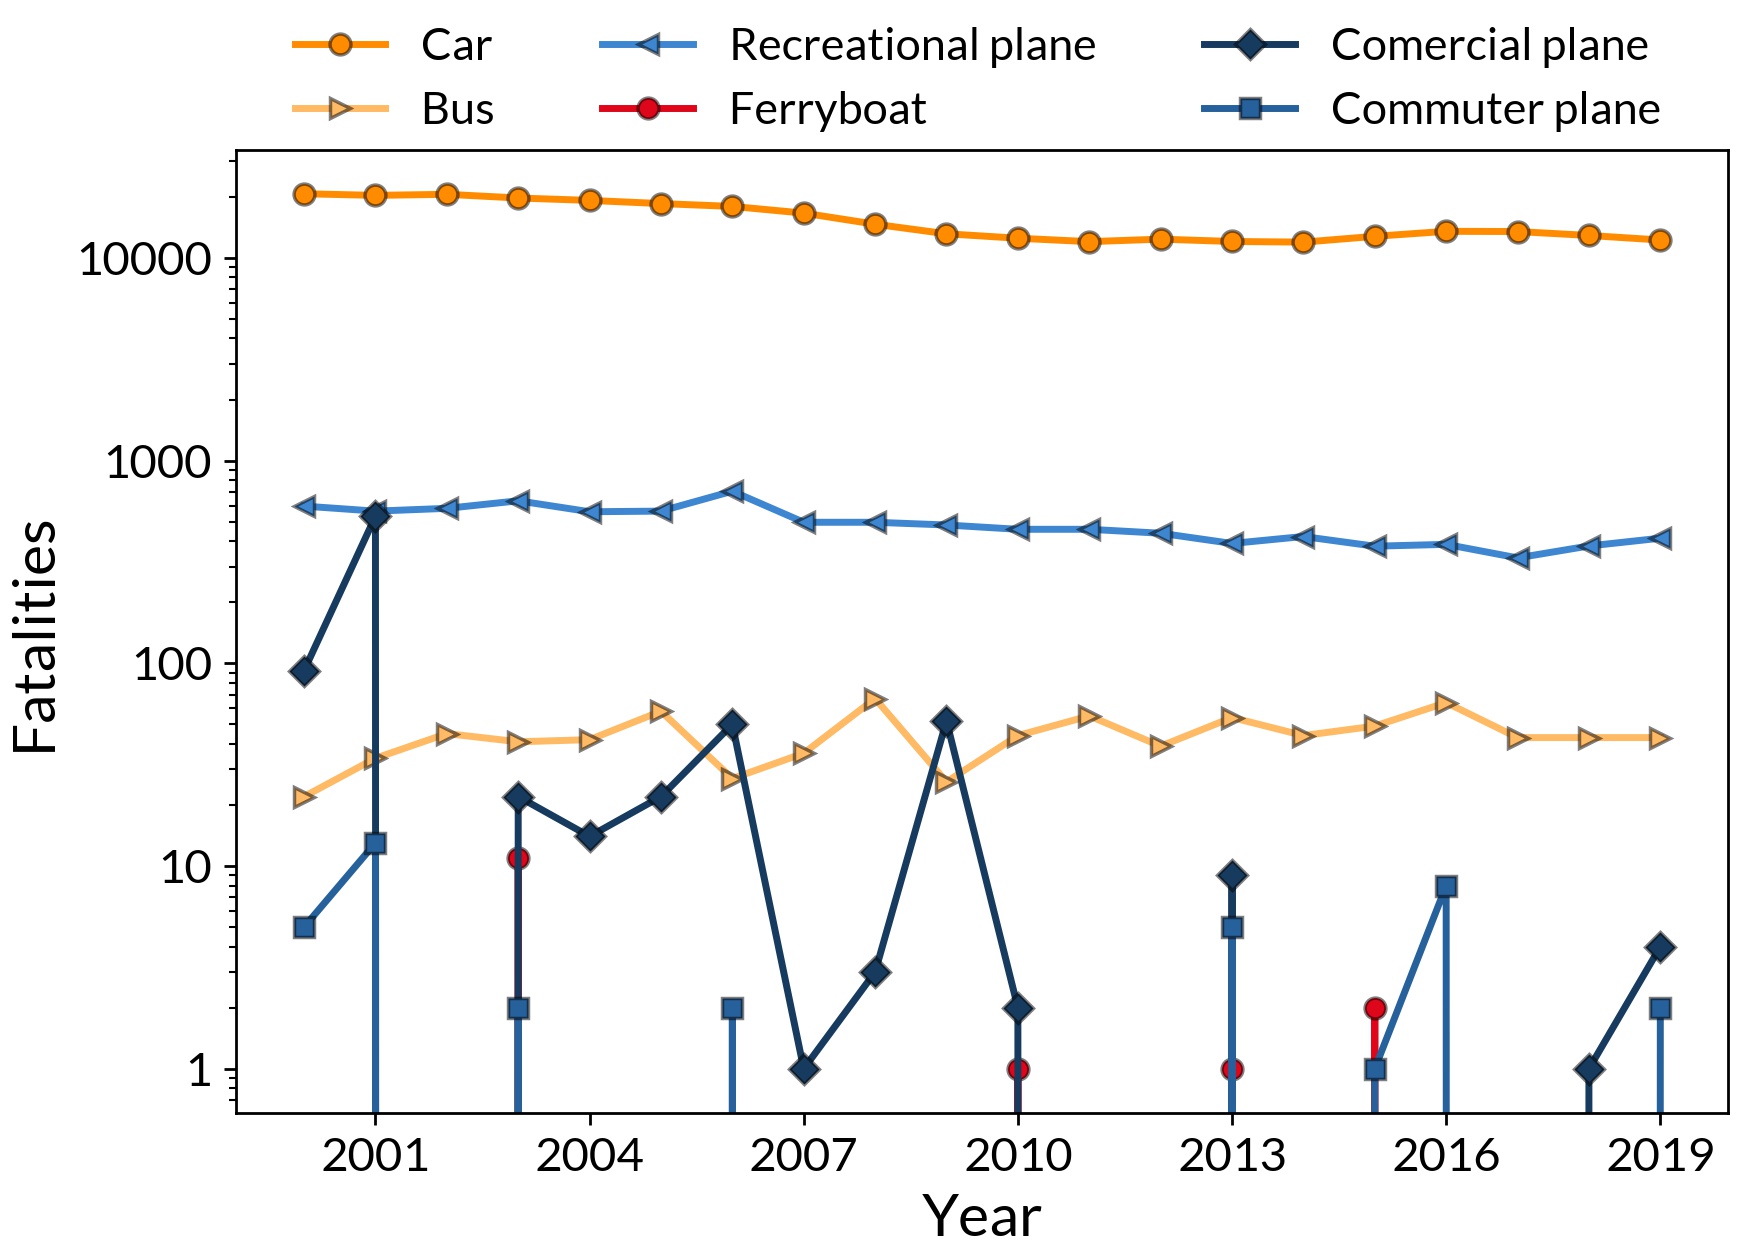
The fatality rates for commuter planes seem very high. But are these estimates accurate? The problem is that these planes don’t accumulate many passenger miles, meaning that we don’t have much data to get a good estimate.
Cars accumulate the highest value of passenger miles. Combined with the relatively high risk of cars, this leads to a very stable and predictable number fatalities each year. Commuter planes are used much less, resulting in an intermittent number of fatalities per year: 1 death in 2015 and 8 in 2016. This is an increase of 800 %!
Therefore, even if we take the average of 10 years to compute the fatality rate of commuter planes, the result can be affected by an isolated event with high fatalities, not representative of the actual safety. To obtain a more accurate estimate, we would simply need a higher use of this transport.
Despite having a low sample size to determine how risky commuter flights are, the current set suggests that they might be more risky than larger commercial flights. To put it in perspective, we would need 1,500 more deaths per year in commercial flights to reach a fatality rate similar to commuter planes. This is about 40 full plane crashes in a decade, and in 2010-2019 there were zero.
The reason for the higher risk of commuter flights is not clear for us. Since this category includes small cargo flights, it could be that the fatalities are due to handling of the cargo. A larger usage of this transport would be needed to get better conclusions.
The safest transport: commercial flights
The data on commercial flights has similar issues than commuter flights. The probability of a fatality is so low that, despite accumulating such enormous amount of flight hours, many more would be needed to obtain a more acculturate value. An added problem is that a single crash of a plane generates a large spike in the fatalities, whereas a motorcycle crash leads to a small increase of just one or two.
In any case, even if an accurate value is hard to obtain, commercial flights remain as the safest transport.
This can be seen in the data from 2000-2009, where the fatalities per passenger miles were 0.07. This is higher than the current 0.002 value, but still much lower than cars. The reason for the higher values of the previous decade were two full crashes which occurred in 2001, killing about 500 people. Still, the fact that having these two crashes led to such low fatality rate of 0.07 (100 times lower than car), highlights how safe commercial planes are.
Quick lines on commercial flights safety
We have seen that is hard to obtain an accurate value of the fatality rate for commercial planes. Therefore, the lines below should be read keeping in mind that they only relate to the US commercial flights, for the period of 2010-2019:
Private flights are risky
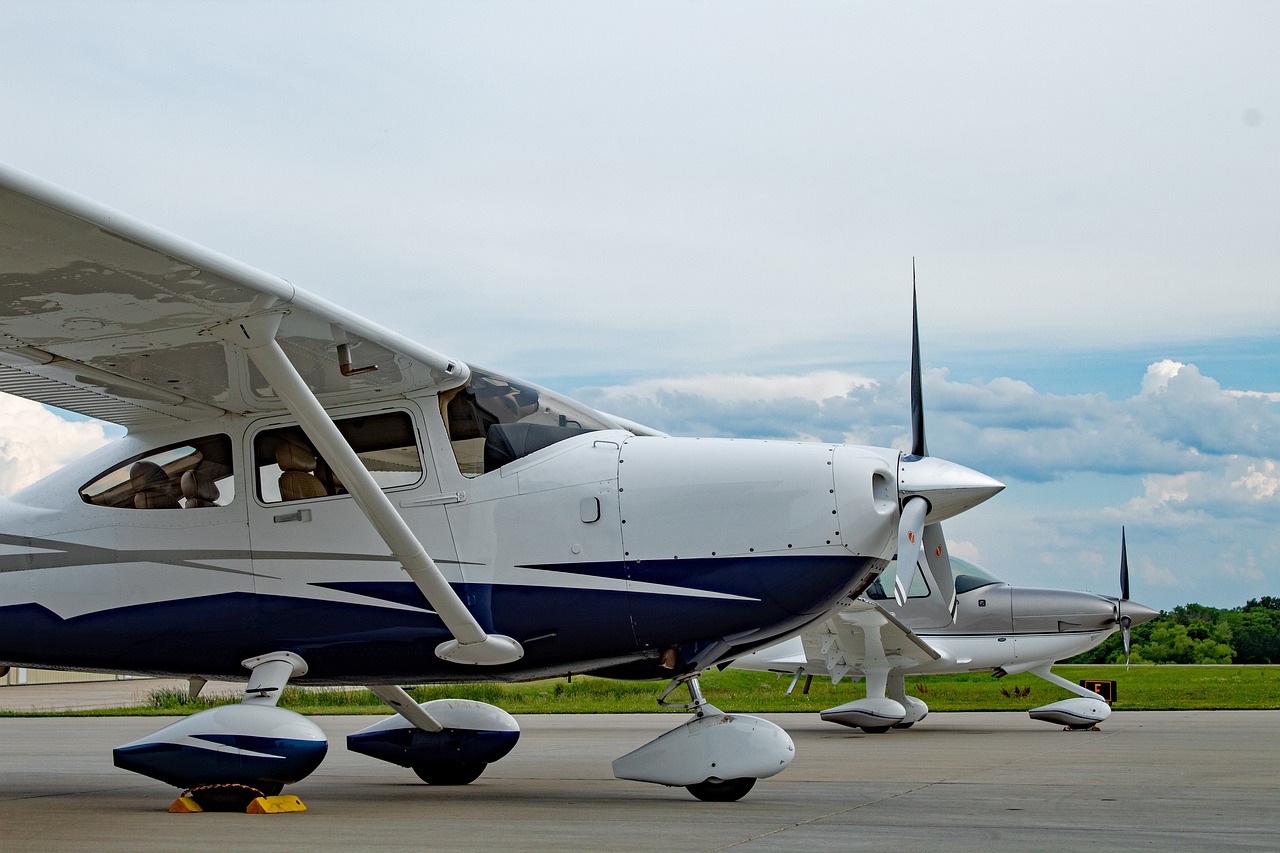
Contrary to commuter or commercial flights, the fatality rate on private planes is expected to have a low statistical error due to the observed stability in the number of deaths each year. Therefore, private planes should actually be 10 times more dangerous than cars.
The reason for the higher risk is attributed to the lower preparation and less strict regulations than in commercial flights. Just as a reference, a pilot for a commercial airline needs a training of 3 years, whereas a private pilot license can be obtained in 6 months. On top of that, maintenance of the planes is much more regulated in the commercial airlines.
Recreational boating also showed a very high number of fatalities compared to passenger boats or freight ships. Unfortunately, the fatality rate of these was not added due to the lack of data on the passenger miles.
Conclusions
Commercial flights are the safest transport mode. In the past decade, there hasn’t been a single full plane crash in the US. The fatalities rate during this past decade so low that even if you fly your during your entire life, you only have 1 out of 1,500 chances of dying.
On the other hand, private flights are about 10 times more dangerous than car. Train and bus are similarly safe as commercial flights. As train can cover large distances, it can be an alternative for people who fear flying.
APPENDIX
The points below show the assumptions done when data on fatalities, passenger miles or passenger hours wasn’t available.
Land vehicles: There is no data on passenger hours for land vehicles. Therefore, the average speed given in the Journal of Transport Statistics was used in combination with the passenger miles to obtain them: car 34.4 mph, light vehicle 31.8 mph, motorcycle 38.4 mph, heavy truck 33.6 mph, bus 21 mph.
Bus: fatalities data missing from 2019 is carried over from 2018.
Train: There is no data on passenger hours for trains. The average speed of commuter trains is available at BTS, about 32 mph. The average speed of Amtrak is assumed to be 84 mph, based on data from the Northeast Corridor. These two speeds are combined to make an average speed of trains.
Flights: Data on passenger miles is not available. An average number of passengers per plane was assumed for each to obtain it. Commercial flights were taken as 100. Commuter flights 9, which would be the maximum number of people allowed in this category, therefore giving a lower estimate on the fatality rate. For private flights, data on passenger miles available at BTS until 2001 is used to estimate an average number of passengers of 3.5 and an average speed of 135 mph, needed to get the passenger hours. For all flights, data missing in 2011 is taken from 2010.
Ferryboat: The number of fatalities is not taken from BTS since this one aggregates from other transportation such as inclined plane and cableway. Data is aggregated from the Federal Transit Administration. To get the passenger hours, the average speed available at BTS of 8.5 mph is used.
References
US Bureau of Transportation Statistics. National Transportation Statistics.
US Federal Transit Administration. Annual National Transit Summaries and Trends.
Savage I., 2013. Comparing the fatality risks in United States transportation across modes and over time. Research in Transportation Economics, 43, 9-22.